This is the full developer documentation for Cased Documentation
# AI infrastructure automation
> AI agents that handle your platform engineering and infrastructure busy work so you can focus on your product.
AI agents that handle your platform engineering and infrastructure busy work so you can focus on your product.
Cased provides AI infrastructure automation through three core components:
* **Agents** - Pre-configured AI assistants that run on schedules or triggers to handle repetitive infrastructure tasks.
* **Telemetry** - Agent-first observability. Errors, metrics, and traces flow to AI agents that can query, analyze, and act on them.
* **A public API** for programmatic access to Cased.
[Agents ](/agents/overview)Pre-configured AI that runs automatically to monitor and manage infrastructure.
[Telemetry ](/telemetry/overview)Agent-first error tracking and observability - no dashboards, just AI.
***
## Cased CD
[Section titled “Cased CD”](#cased-cd)
Cased CD is an open-source continuous deployment dashboard that gives teams visibility and control over their deployments. It integrates with Cased Agents for end-to-end deployment intelligence—from triggering deploys to monitoring their health in production.
**Enterprise features:**
* **RBAC and approval workflows** - Control who can deploy to which environments
* **Audit trails** - Complete history of all deployment activity
* **SSO integration** - Connect with Okta, AWS Cognito, and other identity providers
[Cased CD ](/cased-cd)Open-source deployment dashboard with RBAC, audit trails, and SSO.
***
#### Get Support
[Section titled “Get Support”](#get-support)
[Need help? ](mailto:support@cased.com)Have questions or need assistance? Reach out to our support team at support\@cased.com
# Custom Agents
> Create custom AI agents to automate infrastructure tasks for you and your team
Create custom AI agents to automate infrastructure tasks for you and your team
## What are custom agents
[Section titled “What are custom agents”](#what-are-custom-agents)
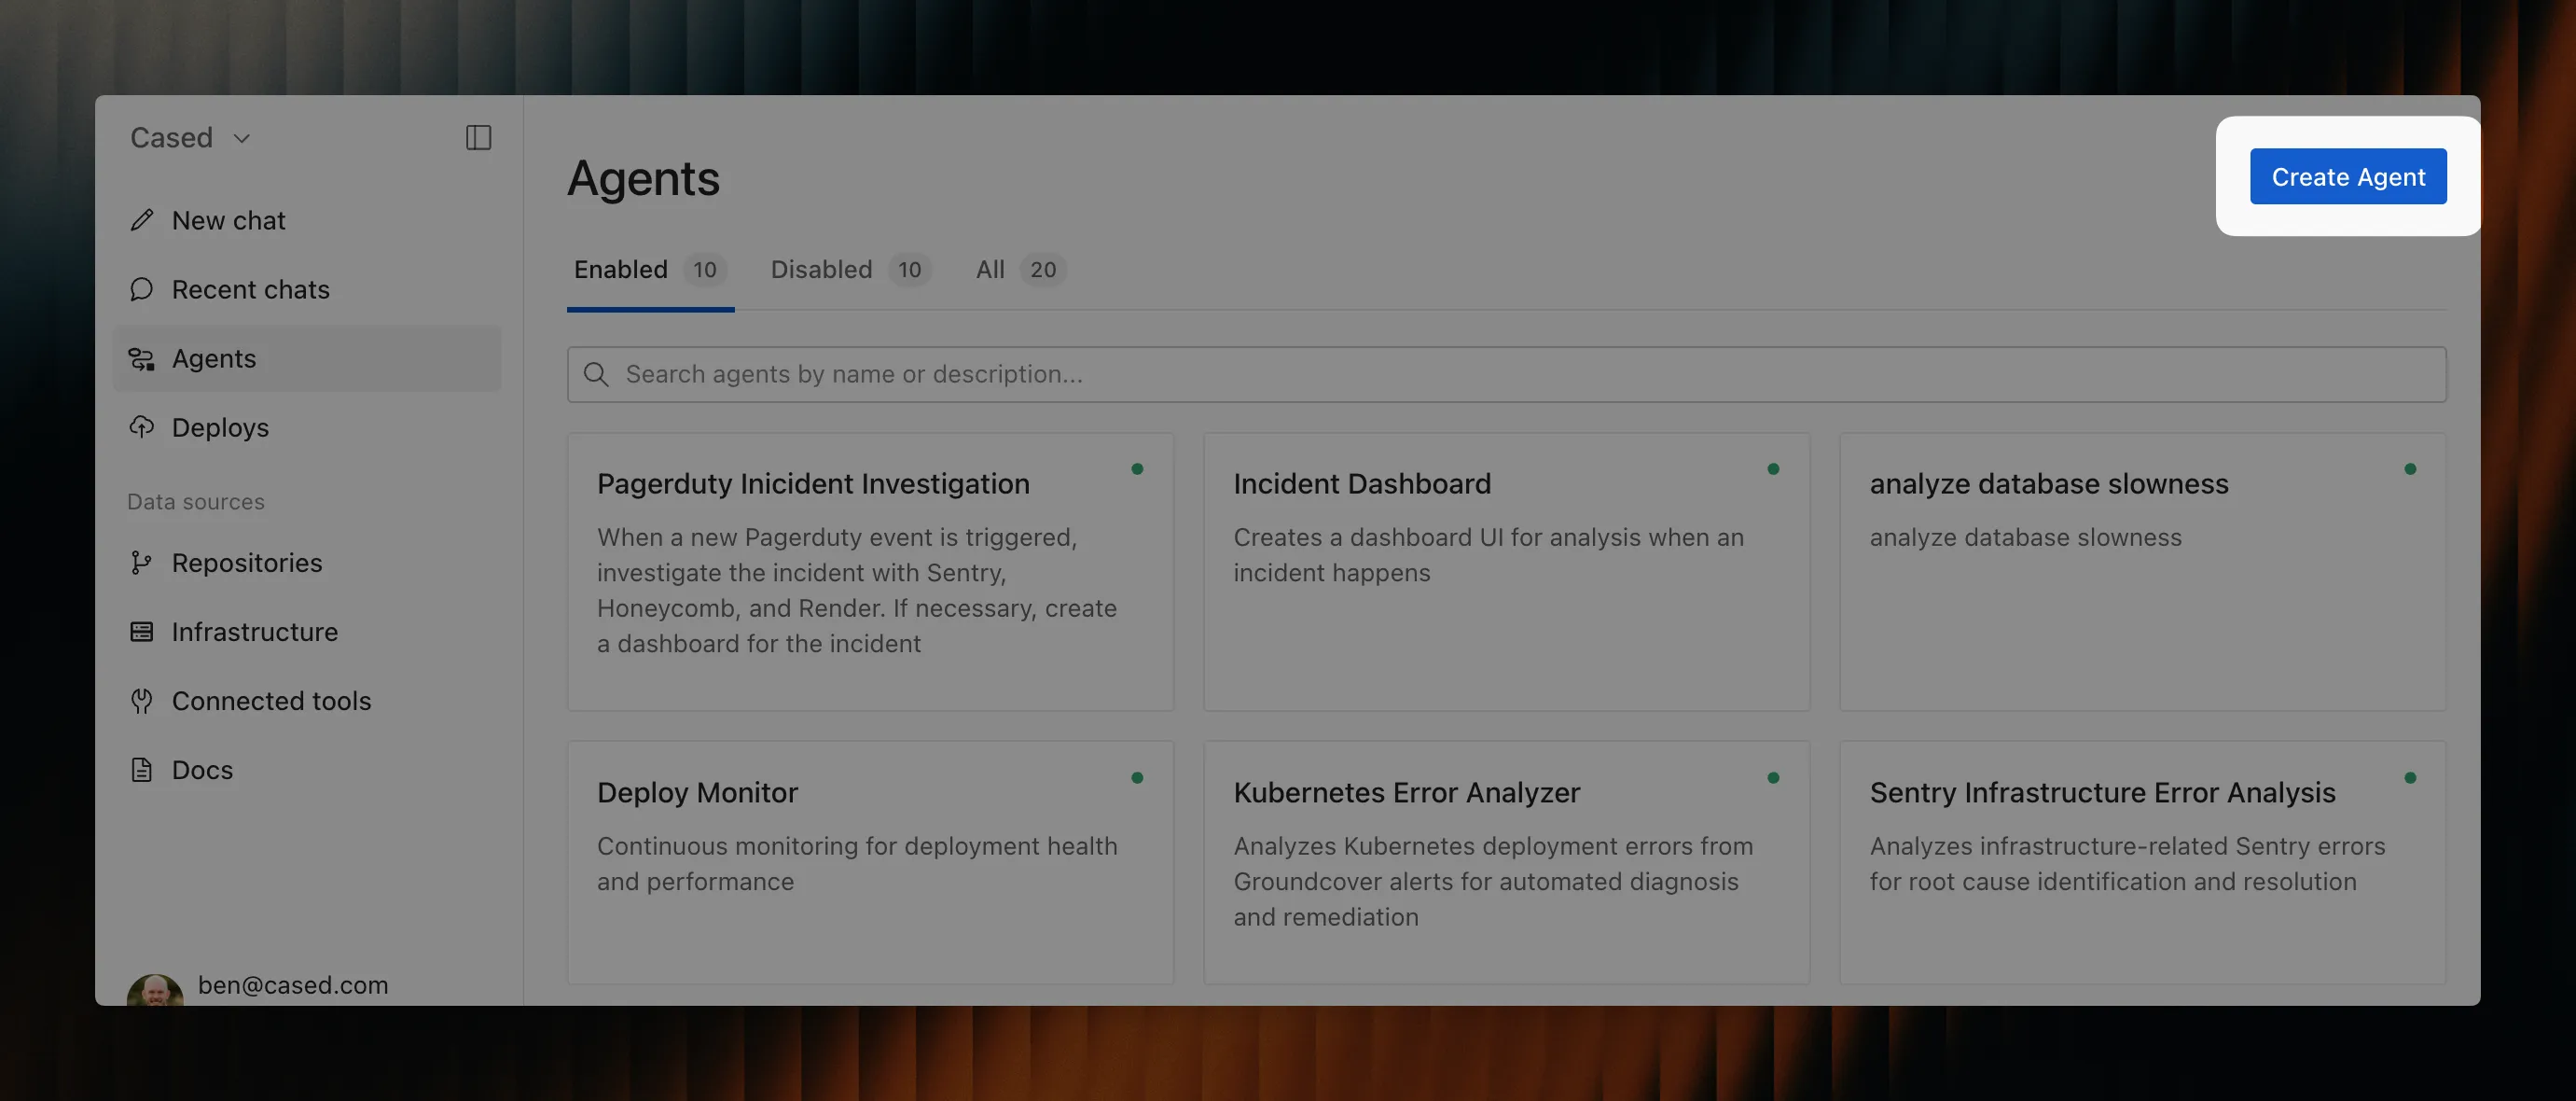
Custom agents let you define automated tasks that Cased’s AI performs on a schedule or trigger. They work just like the default agents that ship with Cased, but can be tailored to your organization’s specific needs and processes.
## How custom agents work
[Section titled “How custom agents work”](#how-custom-agents-work)
Cased’s AI excels at infrastructure automation tasks like monitoring resources, managing deploys, and debugging production issues. Custom agents enable you to give it specific instructions to handle infrastructure tasks automatically.
Each agent combines three key elements:
### Triggers
[Section titled “Triggers”](#triggers)
Agents can be triggered in three ways:
* **Scheduled** - Run the agent on a regular schedule (daily, weekly, monthly)
* **Webhooks** - Trigger when Cased receives a webhook from external systems
* **API** - Start on-demand via API call
### Context
[Section titled “Context”](#context)
The agent needs access to your systems to be effective. Connect these integrations to give agents the context they need:
**Essential integrations:**
* [AWS](/integrations/aws) - Monitor resources, costs, and security
* [GitHub](/integrations/github) - Analyze code, review PRs, track deployments
**Recommended additions:**
* [Slack](/integrations/slack) - Send notifications and alerts
* [Sentry](/integrations/sentry) - Analyze errors and exceptions
* [DataDog](/integrations/datadog) - Monitor metrics and logs
* [PagerDuty](/integrations/pagerduty) - Respond to incidents
### Agent prompt
[Section titled “Agent prompt”](#agent-prompt)
The prompt provides clear instructions for what the agent should do. Write prompts as if explaining the task to a senior engineer.
**Example prompt for a deployment health check:**
```plaintext
After each deployment to production:
1. Check error rates in Sentry for new exceptions
2. Monitor CPU and memory usage in DataDog
3. Verify all health checks are passing
4. Review deployment logs for warnings
5. If issues found, summarize in Slack #deployments channel
6. If critical issues, create PagerDuty incident
```
## Creating your first agent
[Section titled “Creating your first agent”](#creating-your-first-agent)
1. **Navigate to Agents** in your Cased dashboard
2. **Click “Create agent”**
3. **Configure the basics:**
* Name: Descriptive name like “Daily Infrastructure Audit”
* Trigger: Choose scheduled, webhook, or API
* Schedule: Set timing if using scheduled trigger
4. **Write your prompt:**
* Be specific about what to check
* Include success/failure criteria
* Specify where to report results
5. **Test the agent:**
* Use “Run now” to test immediately
* Review the agent’s actions and output
* Refine prompt based on results
6. **Enable and monitor:**
* Turn on the agent when ready
* Check execution history regularly
* Iterate based on effectiveness
## Best practices
[Section titled “Best practices”](#best-practices)
### Write clear prompts
[Section titled “Write clear prompts”](#write-clear-prompts)
✅ **Good prompt:**
```plaintext
Check all EC2 instances for:
- Instances running longer than 30 days without restart
- Instances without recent backups
- Development instances running outside business hours
Report findings in #aws-alerts with instance IDs and recommendations
```
❌ **Vague prompt:**
```plaintext
Check our servers and let me know if anything looks wrong
```
### Start simple, then expand
[Section titled “Start simple, then expand”](#start-simple-then-expand)
Begin with basic agents and add complexity as you validate they work:
1. Start: Check S3 buckets for public access
2. Expand: Also check for missing encryption
3. Enhance: Add automatic remediation for common issues
### Use parameters for flexibility
[Section titled “Use parameters for flexibility”](#use-parameters-for-flexibility)
Make agents reusable across environments:
```plaintext
Check database backup status for {{ environment }}:
- Verify backup completed in last {{ backup_hours }} hours
- Check backup size is within {{ size_variance }}% of average
- Alert {{ slack_channel }} if issues found
```
# Default Agents
> Pre-built AI agents for common infrastructure automation tasks
Pre-built AI agents for common infrastructure automation tasks
Cased comes with default agents that are automatically available to your organization. These agents handle common infrastructure automation tasks and can be enabled from your Agents dashboard.
## Sentry Infrastructure Error Analysis
[Section titled “Sentry Infrastructure Error Analysis”](#sentry-infrastructure-error-analysis)
Automatically analyzes Sentry errors to determine if they’re infrastructure-related, identifies root cause, and creates fix sessions.
**Trigger:** `sentry.issue.created` (when a new Sentry issue is created)
**What it does:**
* Classifies errors as infrastructure-related or application logic
* Analyzes database, cloud service, message queue, cache, and network errors
* Skips application logic errors (null pointers, validation errors, UI bugs)
* Sends analysis to Slack with root cause and affected code
* Spawns fix sessions for infrastructure issues
**Infrastructure errors it handles:**
* Database connection/query errors (PostgreSQL, MySQL, Redis, MongoDB)
* Cloud service errors (AWS S3, SQS, Lambda, ECS, RDS, GCP, Azure)
* Message queue errors (Kafka, RabbitMQ, SQS, SNS)
* Network/connectivity errors (timeouts, DNS, SSL/TLS)
* Container/orchestration errors (Docker, Kubernetes, ECS)
## Deploy Monitor
[Section titled “Deploy Monitor”](#deploy-monitor)
Continuously monitors deployment health and performance, providing real-time status updates and post-deployment analysis.
**Trigger:** `deployment.deployment.started` (when a deployment begins)
**What it does:**
* Monitors GitHub Actions workflow progress
* Checks for database migrations and secrets updates
* Generates interactive deployment UI (if available)
* Monitors every minute during deployment
* Continues monitoring for 30 minutes after deployment completes
* Compares pre/post deployment metrics
* Suggests rollback if issues are detected
* Posts updates to Slack throughout the process
**Slack notifications include:**
* Deploy start with commit, branch, and deployer info
* Migration and secrets detection alerts
* Real-time monitoring updates
* Error alerts with Sentry links
* Final summary with timing, errors, and health assessment
## Kubernetes Error Analyzer
[Section titled “Kubernetes Error Analyzer”](#kubernetes-error-analyzer)
Analyzes Kubernetes alerts from Groundcover to diagnose infrastructure issues and suggest remediation.
**Trigger:** `groundcover.alert.fired` (when a Groundcover alert fires)
**What it does:**
* Classifies errors by priority (config errors, resource exhaustion, runtime issues)
* Gathers diagnostic information from cluster state
* Reviews pod logs, events, and configurations
* Identifies root cause and recent changes
* Reports findings to Slack with remediation steps
* Spawns fix sessions for configuration errors
**Error types it handles:**
* **High Priority:** Secret/ConfigMap mismatches, invalid image references, RBAC issues
* **Medium Priority:** OOMKilled pods, CPU throttling, disk pressure
* **Lower Priority:** CrashLoopBackOff, probe failures, network issues
## Add Deploy Monitor Action
[Section titled “Add Deploy Monitor Action”](#add-deploy-monitor-action)
Helps you add the Cased Deploy Monitor GitHub Action to your repository’s deployment workflow.
**Trigger:** Manual (on-demand)
**What it does:**
* Lists your GitHub Actions workflows
* Identifies the deployment workflow
* Determines the optimal insertion point
* Creates a PR adding the `cased-deploy-notification-action`
* Includes setup instructions for the `CASED_API_KEY` secret
This agent is useful for initial setup when you want to start tracking deployments in Cased.
# Agents Overview
> Pre-configured AI assistants that run on schedules or triggers to handle repetitive infrastructure tasks
Pre-configured AI assistants that run on schedules or triggers to handle repetitive infrastructure tasks
## What are agents
[Section titled “What are agents”](#what-are-agents)
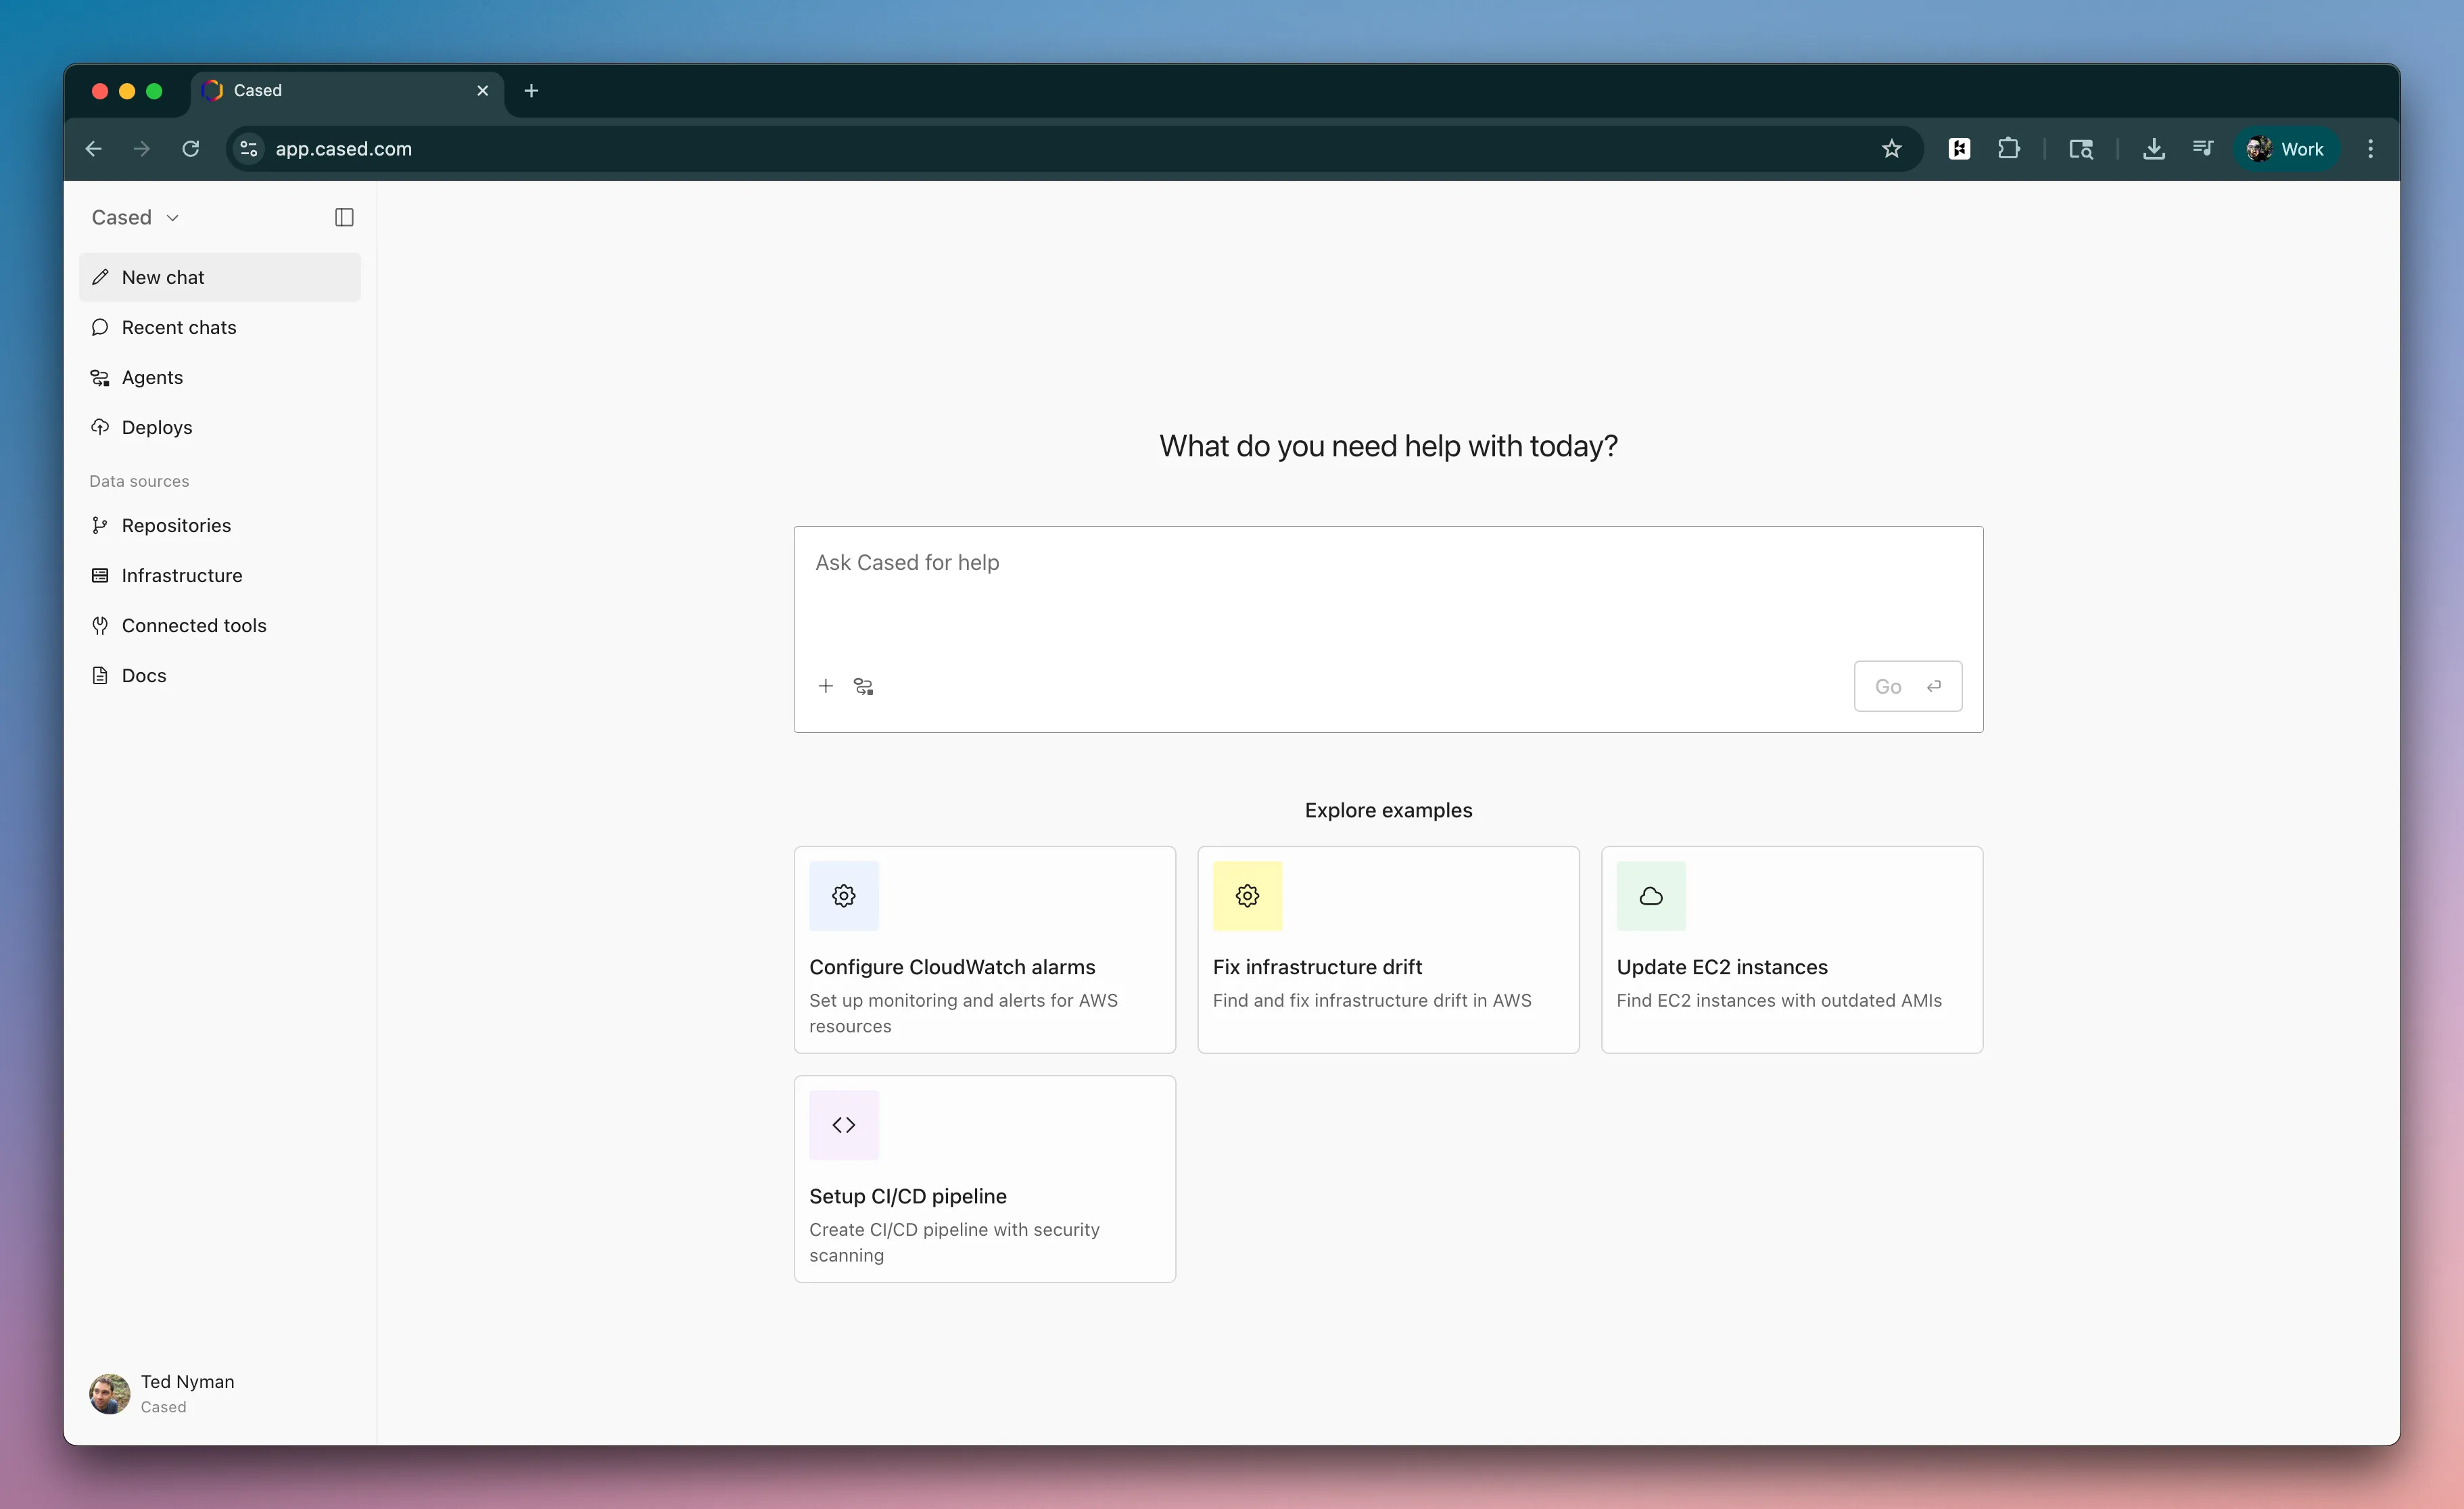
Agents are pre-configured AI assistants that handle repetitive infrastructure automation tasks automatically. You define what the agent should do, and it runs on a schedule or trigger without manual intervention.
There are multiple ways to trigger an agent:
* **Event-driven** - Triggered by webhooks from external systems (Sentry issues, deployments, Kubernetes alerts)
* **Scheduled** - Run on a regular schedule (daily, weekly, monthly)
* **API** - Start on-demand via API call
Once triggered, the agent creates a new session and follows its instructions to complete infrastructure tasks for you.
## Default agents
[Section titled “Default agents”](#default-agents)
Cased comes with default agents for your organization. See [Default Agents](/agents/default-agents) for detailed explanations.
* **Sentry Infrastructure Error Analysis** - Analyzes Sentry errors for infrastructure issues and creates fix sessions
* **Deploy Monitor** - Monitors deployment health and provides real-time status updates
* **Kubernetes Error Analyzer** - Diagnoses Kubernetes alerts from Groundcover
* **Add Deploy Monitor Action** - Helps add the Cased Deploy Monitor to your GitHub Actions
## How to configure agents
[Section titled “How to configure agents”](#how-to-configure-agents)
1. **Navigate to Agents** in your Cased dashboard
2. **Enable relevant agents** for your infrastructure setup
3. **Configure integrations** - Connect Sentry, GitHub, Slack, and other tools
4. **Set notification channels** - Choose where to receive alerts and updates
5. **Monitor results** in your dashboard or notification channels
Agents run autonomously once configured and improve system reliability by catching issues early.
# Public API
> The Cased API allows you to programmatically interact with Cased. All endpoints are available under `https://app.cased.com/api/`.
The Cased API allows you to programmatically interact with Cased. All endpoints are available under \`https\://app.cased.com/api/\`.
## Authentication
[Section titled “Authentication”](#authentication)
All requests to the Cased API must be authenticated with an API key. You can create an API key in your organization’s settings.
The API key must be included in the `Authorization` header of your request:
`Authorization: Bearer YOUR_API_KEY`
***
## Deployment Events
[Section titled “Deployment Events”](#deployment-events)
### Create a Deployment Event
[Section titled “Create a Deployment Event”](#create-a-deployment-event)
Notifies Cased that a deployment has occurred. This will trigger a new agent session in Mission Control to monitor the deployment.
**`POST /api/v1/deployments/`**
#### Body
[Section titled “Body”](#body)
| Field | Type | Description |
| ---------------------- | ------ | ------------------------------------------------------------------------------------------------------------------------------------------------- |
| `deployment_request` | string | **Required.** A description of the deployment (e.g., “Production deploy v1.2.3”). |
| `repository_full_name` | string | The full name of the repository that is being deployed (e.g., “my-org/my-repo”). Required if you have more than one project in your organization. |
| `status` | string | The current status of the deployment. Can be one of `pending`, `running`, `success`, `failure`, or `cancelled`. Defaults to `success`. |
| `external_url` | string | An optional URL that links back to your deployment system. |
| `commit_sha` | string | An optional commit SHA for the deployment. |
| `commit_message` | string | An optional commit message for the deployment. |
| `ref` | string | The Git ref that is being deployed (e.g., `refs/heads/main`). |
| `event_metadata` | object | An optional JSON object that can be used to store any additional metadata about the deployment. |
#### Example Request
[Section titled “Example Request”](#example-request)
```bash
curl -X POST https://app.cased.com/api/v1/deployments/ \
-H "Authorization: Bearer YOUR_API_KEY" \
-H "Content-Type: application/json" \
-d '{
"deployment_request": "Deploying version 2.5.1 to production",
"repository_full_name": "your-org/your-repo",
"status": "running",
"external_url": "https://github.com/your-org/your-repo/actions/runs/12345",
"commit_sha": "f2c1c6a",
"ref": "refs/heads/main"
}'
```
#### Example Response
[Section titled “Example Response”](#example-response)
```json
{
"id": "deployment-event-uuid",
"status": "running",
"created_at": "2024-01-15T10:30:00Z"
}
```
***
## Agent Sessions
[Section titled “Agent Sessions”](#agent-sessions)
### Create an Agent Session
[Section titled “Create an Agent Session”](#create-an-agent-session)
Creates a new AI agent session to analyze problems, investigate issues, or perform tasks. This will start an agent that can help troubleshoot problems, analyze logs, or provide insights.
**`POST /api/v1/agent/sessions/`**
#### Body
[Section titled “Body”](#body-1)
| Field | Type | Description |
| --------- | ------ | -------------------------------------------------------------------------------------------------------------------------------------------- |
| `prompt` | string | **Required.** Description of the problem or task for the agent (e.g., “Investigate high error rates in production”). |
| `context` | object | An optional JSON object containing additional context about the issue, such as error messages, logs, environment info, or any relevant data. |
#### Example Request
[Section titled “Example Request”](#example-request-1)
```bash
curl -X POST https://app.cased.com/api/v1/agent-sessions/ \
-H "Authorization: Bearer YOUR_API_KEY" \
-H "Content-Type: application/json" \
-d '{
"prompt": "Investigate why our API response times increased 300% in the last hour",
"context": {
"service": "user-api",
"environment": "production",
"error_rate": "15%",
"avg_response_time": "2.3s",
"logs": ["2024-01-15 10:45:23 ERROR Database connection timeout", "2024-01-15 10:46:01 WARN High memory usage detected"]
}
}'
```
#### Example Response
[Section titled “Example Response”](#example-response-1)
```json
{
"session_id": "agent-session-uuid",
"status": "active",
"created_at": "2024-01-15T10:45:00Z",
"url": "/agents/agent-session-uuid"
}
```
The agent will immediately start analyzing the problem based on your prompt and context. You can monitor the agent’s progress and interact with it through the Cased web interface using the returned `url`.
***
## Workflows
[Section titled “Workflows”](#workflows)
### List Workflows
[Section titled “List Workflows”](#list-workflows)
Returns a list of all workflows configured for your organization.
**`GET /api/v1/workflows/`**
#### Query Parameters
[Section titled “Query Parameters”](#query-parameters)
| Parameter | Type | Description |
| ------------ | ------- | ------------------------------------------------ |
| `name` | string | Filter workflows by name (partial match) |
| `agent_name` | string | Filter by agent name |
| `repository` | string | Filter by repository ID |
| `page` | integer | Page number (default: 1) |
| `page_size` | integer | Number of items per page (default: 20, max: 100) |
#### Example Request
[Section titled “Example Request”](#example-request-2)
```bash
curl -X GET "https://app.cased.com/api/v1/workflows/" \
-H "Authorization: Bearer YOUR_API_KEY"
```
#### Example Response
[Section titled “Example Response”](#example-response-2)
```json
{
"workflows": [
{
"id": "workflow-uuid",
"name": "Infrastructure Cost Analysis",
"agent_name": "infra_cost",
"description": "Analyzes infrastructure costs and provides optimization recommendations",
"status": "active"
}
],
"count": 1,
"next": null,
"previous": null
}
```
### Get Workflow Details
[Section titled “Get Workflow Details”](#get-workflow-details)
Returns details for a specific workflow.
**`GET /api/v1/workflows/{workflow_id}/`**
#### Example Request
[Section titled “Example Request”](#example-request-3)
```bash
curl -X GET "https://app.cased.com/api/v1/workflows/{workflow_id}/" \
-H "Authorization: Bearer YOUR_API_KEY"
```
#### Example Response
[Section titled “Example Response”](#example-response-3)
```json
{
"id": "workflow-uuid",
"name": "Infrastructure Cost Analysis",
"agent_name": "infra_cost",
"description": "Analyzes infrastructure costs and provides optimization recommendations",
"instruction": "Analyze AWS costs and identify optimization opportunities...",
"status": "active",
"created_at": "2024-01-10T09:00:00Z",
"updated_at": "2024-01-15T14:30:00Z"
}
```
### Trigger a Workflow
[Section titled “Trigger a Workflow”](#trigger-a-workflow)
Runs a workflow with its pre-configured instructions. Workflows are designed to perform specific tasks like cost analysis, security reviews, or compliance checks.
**`POST /api/v1/workflows/{workflow_id}/runs/`**
#### Body
[Section titled “Body”](#body-2)
| Field | Type | Description |
| -------------- | ------ | ------------------------------------------------------------------------------------------------- |
| `triggered_by` | string | Type of trigger: `manual`, `schedule`, or `event`. Defaults to `manual`. |
| `trigger_name` | string | Optional name or description for this run. |
| `context` | object | Optional context data for workflows that need specific inputs (e.g., deployment\_id, pr\_number). |
#### Example Request
[Section titled “Example Request”](#example-request-4)
```bash
curl -X POST "https://app.cased.com/api/v1/workflows/{workflow_id}/runs/" \
-H "Authorization: Bearer YOUR_API_KEY" \
-H "Content-Type: application/json" \
-d '{
"triggered_by": "manual",
"trigger_name": "Weekly cost review",
"context": {
"environment": "production",
"time_range": "last_7_days"
}
}'
```
#### Example Response
[Section titled “Example Response”](#example-response-4)
```json
{
"id": "workflow-run-uuid",
"workflow": "workflow-uuid",
"workflow_name": "Infrastructure Cost Analysis",
"triggered_by": "manual",
"trigger_name": "Weekly cost review",
"status": "running",
"session_id": "agent-session-uuid",
"started_at": "2024-01-15T15:00:00Z",
"created_at": "2024-01-15T15:00:00Z"
}
```
The workflow will run with its pre-configured instructions, using any provided context for variable substitution. The `session_id` links to the agent session where you can monitor progress.
### List Workflow Runs
[Section titled “List Workflow Runs”](#list-workflow-runs)
Returns a list of all runs for a specific workflow.
**`GET /api/v1/workflows/{workflow_id}/runs/`**
#### Query Parameters
[Section titled “Query Parameters”](#query-parameters-1)
| Parameter | Type | Description |
| -------------- | ------- | ------------------------------------------------------------- |
| `status` | string | Filter by status: `pending`, `running`, `completed`, `failed` |
| `triggered_by` | string | Filter by trigger type: `manual`, `schedule`, `event` |
| `page` | integer | Page number (default: 1) |
| `page_size` | integer | Number of items per page (default: 20, max: 100) |
#### Example Request
[Section titled “Example Request”](#example-request-5)
```bash
curl -X GET "https://app.cased.com/api/v1/workflows/{workflow_id}/runs/?status=completed" \
-H "Authorization: Bearer YOUR_API_KEY"
```
#### Example Response
[Section titled “Example Response”](#example-response-5)
```json
{
"workflow_runs": [
{
"id": "workflow-run-uuid",
"workflow": "workflow-uuid",
"workflow_name": "Infrastructure Cost Analysis",
"triggered_by": "schedule",
"trigger_name": "Daily run",
"status": "completed",
"session_id": "agent-session-uuid",
"started_at": "2024-01-15T00:00:00Z",
"ended_at": "2024-01-15T00:15:00Z",
"created_at": "2024-01-15T00:00:00Z"
}
],
"count": 1,
"next": null,
"previous": null
}
```
### Get Workflow Run Details
[Section titled “Get Workflow Run Details”](#get-workflow-run-details)
Returns details for a specific workflow run.
**`GET /api/v1/workflows/{workflow_id}/runs/{run_id}/`**
#### Example Request
[Section titled “Example Request”](#example-request-6)
```bash
curl -X GET "https://app.cased.com/api/v1/workflows/{workflow_id}/runs/{run_id}/" \
-H "Authorization: Bearer YOUR_API_KEY"
```
#### Example Response
[Section titled “Example Response”](#example-response-6)
```json
{
"id": "workflow-run-uuid",
"workflow": "workflow-uuid",
"workflow_name": "Infrastructure Cost Analysis",
"triggered_by": "manual",
"trigger_name": "Cost investigation",
"status": "completed",
"session_id": "agent-session-uuid",
"started_at": "2024-01-15T10:00:00Z",
"ended_at": "2024-01-15T10:12:00Z",
"artifacts": {
"session_id": "agent-session-uuid"
},
"created_at": "2024-01-15T10:00:00Z",
"updated_at": "2024-01-15T10:12:00Z"
}
```
# Cased CD
> A modern UI for ArgoCD with RBAC, audit trails, and SSO support
A modern UI for ArgoCD with RBAC, audit trails, and SSO support
Cased CD is a modern, redesigned UI for ArgoCD that provides enterprise features like fine-grained RBAC, comprehensive audit trails, SSO authentication, and group management.
## Features
[Section titled “Features”](#features)
* **RBAC management** — Fine-grained role-based access control per application
* **Audit trail** — Complete action history with before/after change tracking
* **User management** — Create and manage users directly from the UI
* **SSO authentication** — AWS Cognito, Okta, Auth0, Azure AD, Google
* **Group management** — Organize users into groups with inherited permissions
* **Notifications** — Slack, webhook, and email integrations
* **Login tracking** — Track all login attempts with IP addresses
## Quick links
[Section titled “Quick links”](#quick-links)
[Installation ](/cased-cd/installation)Deploy Cased CD Enterprise to your cluster
[Configuration ](/cased-cd/configuration)Connect to ArgoCD and configure settings
[SSO setup ](/cased-cd/authentication/sso-overview)Configure single sign-on with your identity provider
[Environment variables ](/cased-cd/reference/environment-variables)Complete reference for all configuration options
## Requirements
[Section titled “Requirements”](#requirements)
* **ArgoCD** v2.0 or later
* **Kubernetes** 1.19+
* **Storage** StorageClass for audit log PVC (uses cluster default)
* **Browsers** Chrome, Firefox, Safari, Edge (modern versions)
***
Looking for the free, open-source UI? Check out [Cased CD Community Edition](https://github.com/cased/cased-cd) on GitHub.
# AWS Cognito SSO
> Configure AWS Cognito single sign-on for Cased CD Enterprise
Configure AWS Cognito single sign-on for Cased CD Enterprise
This guide walks through setting up AWS Cognito as your identity provider for Cased CD Enterprise.
## Prerequisites
[Section titled “Prerequisites”](#prerequisites)
* AWS account with Cognito access
* Cased CD Enterprise deployed
* ArgoCD 2.0+
## Setup
[Section titled “Setup”](#setup)
1. **Create a Cognito User Pool**
```bash
aws cognito-idp create-user-pool \
--pool-name "cased-cd-sso" \
--region us-west-2 \
--auto-verified-attributes email \
--policies "PasswordPolicy={MinimumLength=8,RequireUppercase=true,RequireLowercase=true,RequireNumbers=true,RequireSymbols=false}"
```
Note the **User Pool ID** from the output (e.g., `us-west-2_XXXXXXXXX`).
2. **Create a Cognito domain**
```bash
aws cognito-idp create-user-pool-domain \
--domain "your-company-cased-cd" \
--user-pool-id us-west-2_XXXXXXXXX \
--region us-west-2
```
Your domain will be: `your-company-cased-cd.auth.us-west-2.amazoncognito.com`
3. **Create an App Client (public, no secret)**
Caution
The App Client must be a **public client** (no secret) for browser-based authentication to work.
```bash
aws cognito-idp create-user-pool-client \
--user-pool-id us-west-2_XXXXXXXXX \
--client-name "cased-cd" \
--region us-west-2 \
--no-generate-secret \
--callback-urls "https://cased-cd.example.com/auth/callback" \
--logout-urls "https://cased-cd.example.com/login" \
--allowed-o-auth-flows "code" \
--allowed-o-auth-scopes "openid" "profile" "email" \
--allowed-o-auth-flows-user-pool-client \
--supported-identity-providers "COGNITO"
```
Note the **Client ID** from the output.
For local development, also add `http://localhost:5173/auth/callback` to callback URLs.
4. **Configure ArgoCD**
```bash
kubectl patch configmap argocd-cm -n argocd --type merge -p '
data:
url: "https://cased-cd.example.com"
oidc.config: |
name: AWS Cognito
issuer: https://cognito-idp.us-west-2.amazonaws.com/us-west-2_XXXXXXXXX
clientID: YOUR_CLIENT_ID
requestedScopes: ["openid", "profile", "email"]
'
```
5. **Configure Cased CD with Cognito domain**
```bash
helm upgrade cased-cd cased/cased-cd-enterprise \
--namespace argocd \
--set 'imagePullSecrets[0].name=cased-cd-registry' \
--set cognito.domain=your-company-cased-cd.auth.us-west-2.amazoncognito.com
```
Or set the environment variable directly:
```bash
kubectl set env deployment/cased-cd-enterprise \
-n argocd \
COGNITO_DOMAIN=your-company-cased-cd.auth.us-west-2.amazoncognito.com
```
6. **Restart ArgoCD**
```bash
kubectl rollout restart deployment argocd-server -n argocd
```
## Test the login
[Section titled “Test the login”](#test-the-login)
1. Navigate to your Cased CD login page
2. Click “Sign in with AWS Cognito”
3. Log in with your Cognito user credentials
4. You’ll be redirected back and logged in
## Create test users
[Section titled “Create test users”](#create-test-users)
```bash
# Create a user
aws cognito-idp admin-create-user \
--user-pool-id us-west-2_XXXXXXXXX \
--username user@example.com \
--user-attributes Name=email,Value=user@example.com Name=email_verified,Value=true \
--region us-west-2
# Set a permanent password
aws cognito-idp admin-set-user-password \
--user-pool-id us-west-2_XXXXXXXXX \
--username user@example.com \
--password "SecurePassword123!" \
--permanent \
--region us-west-2
```
## Configure groups
[Section titled “Configure groups”](#configure-groups)
Create groups in Cognito and map them to ArgoCD RBAC roles:
```bash
# Create a group in Cognito
aws cognito-idp create-group \
--user-pool-id us-west-2_XXXXXXXXX \
--group-name developers \
--region us-west-2
# Add a user to the group
aws cognito-idp admin-add-user-to-group \
--user-pool-id us-west-2_XXXXXXXXX \
--username user@example.com \
--group-name developers \
--region us-west-2
```
Then configure ArgoCD RBAC:
```bash
kubectl patch configmap argocd-rbac-cm -n argocd --type merge -p '
data:
policy.csv: |
p, role:developer, applications, get, */*, allow
p, role:developer, applications, sync, */*, allow
g, developers, role:developer
'
```
## Troubleshooting
[Section titled “Troubleshooting”](#troubleshooting)
### ”No access token received” error
[Section titled “”No access token received” error”](#no-access-token-received-error)
This usually means the Cognito domain is not configured. Verify:
1. `COGNITO_DOMAIN` environment variable is set on the enterprise deployment
2. The domain matches your Cognito User Pool domain exactly
### ”unauthorized\_client” error
[Section titled “”unauthorized\_client” error”](#unauthorized_client-error)
Check that:
1. The App Client has “Authorization code grant” enabled
2. The callback URL is registered correctly
3. The App Client is a public client (no secret)
### Groups not working
[Section titled “Groups not working”](#groups-not-working)
1. Verify users are added to Cognito groups (not just attributes)
2. Group names in Cognito must match ArgoCD RBAC policy exactly
3. Cognito automatically includes groups in the `cognito:groups` claim
# Using existing Dex SSO
> Connect Cased CD to your existing ArgoCD + Dex setup
Connect Cased CD to your existing ArgoCD + Dex setup
If you already have ArgoCD configured with Dex (using Okta, LDAP, SAML, GitHub, etc.), Cased CD will automatically detect and use your existing SSO configuration. No additional identity provider setup is required.
## How it works
[Section titled “How it works”](#how-it-works)
Cased CD queries ArgoCD’s `/api/v1/settings` endpoint on startup. When it detects a `dexConfig`, it automatically displays an SSO login button that redirects through ArgoCD’s authentication flow.
```plaintext
User clicks "SSO" → ArgoCD /auth/login → Dex → Your IdP (Okta, etc.)
↓
User logged into Cased CD ← ArgoCD callback ← Dex ← IdP authenticates
```
## Prerequisites
[Section titled “Prerequisites”](#prerequisites)
* ArgoCD with Dex already configured and working
* Users can successfully log in to the standard ArgoCD UI via SSO
## Setup
[Section titled “Setup”](#setup)
1. **Verify your Dex configuration is working**
Test that SSO works with the standard ArgoCD UI first:
```bash
# Check ArgoCD has dex config
kubectl get configmap argocd-cm -n argocd -o yaml | grep -A 20 "dex.config"
```
You should see your Dex connector configuration (e.g., SAML, OIDC, LDAP).
2. **Allow Cased CD as a redirect URL**
ArgoCD validates redirect URLs after SSO. Add your Cased CD URL to `additionalUrls` in `argocd-cm` so ArgoCD accepts the redirect back to Cased CD:
```bash
kubectl patch configmap argocd-cm -n argocd --type merge -p '
data:
additionalUrls: "https://cased-cd.example.com"
'
```
Replace `https://cased-cd.example.com` with the URL where Cased CD is accessible. Multiple URLs can be pipe-separated: `"https://cased-cd.example.com|https://cased-cd-staging.example.com"`.
Note
The `url` setting in `argocd-cm` should continue pointing to your ArgoCD server. Do **not** change it. The `additionalUrls` setting tells ArgoCD to also accept redirects to Cased CD.
3. **Deploy Cased CD**
```bash
helm install cased-cd oci://registry-1.docker.io/casedcontainers/cased-cd-enterprise \
--namespace argocd \
--set argocd.url=http://argocd-server.argocd.svc.cluster.local:80
```
Tip
Your existing ArgoCD UI continues to work as before. Both UIs can run side-by-side.
## Test the login
[Section titled “Test the login”](#test-the-login)
1. Navigate to your Cased CD login page
2. You should see an “SSO” button (or “Sign in with SSO”)
3. Click the button
4. You’ll be redirected to your identity provider (Okta, etc.)
5. After authenticating, you’ll be redirected back to Cased CD and logged in
## Troubleshooting
[Section titled “Troubleshooting”](#troubleshooting)
### SSO button doesn’t appear
[Section titled “SSO button doesn’t appear”](#sso-button-doesnt-appear)
**Check that ArgoCD returns dex config:**
```bash
# Port-forward to ArgoCD
kubectl port-forward svc/argocd-server -n argocd 8080:80
# Check settings endpoint
curl -s http://localhost:8080/api/v1/settings | jq '.dexConfig'
```
If this returns `null`, ArgoCD doesn’t have Dex configured.
**Check Cased CD can reach ArgoCD:**
The Cased CD backend must be able to proxy requests to ArgoCD. Verify the `argocd.url` helm value is correct.
**Check browser console:**
Open browser dev tools and look for errors fetching `/api/v1/settings`.
### ”No argocd-initial-admin-secret”
[Section titled “”No argocd-initial-admin-secret””](#no-argocd-initial-admin-secret)
This is expected when using Dex/SSO. ArgoCD disables the built-in admin password when SSO is configured. Use SSO to log in instead.
If you need local admin access for emergencies:
```bash
# Enable local admin (optional)
kubectl patch configmap argocd-cm -n argocd --type merge -p '
data:
admin.enabled: "true"
'
# Create a password
argocd account bcrypt --password 'your-password'
# Add to argocd-secret
kubectl patch secret argocd-secret -n argocd --type merge -p '
stringData:
admin.password: "$2a$10$..."
'
```
### Callback redirects to ArgoCD UI instead of Cased CD
[Section titled “Callback redirects to ArgoCD UI instead of Cased CD”](#callback-redirects-to-argocd-ui-instead-of-cased-cd)
Cased CD passes a `return_url` parameter when initiating the SSO flow so that ArgoCD redirects back to Cased CD after authentication. If you’re landing on the ArgoCD UI instead:
1. Make sure you’re running Cased CD Enterprise (Community edition does not include SSO)
2. Verify your Cased CD URL is listed in `additionalUrls` in `argocd-cm` (see step 2 in Setup above)
3. Check that the SSO button URL contains `return_url=` pointing to your Cased CD domain
4. Verify you’re using a recent version of Cased CD Enterprise (v0.2.25+)
### “Invalid redirect URL” error
[Section titled ““Invalid redirect URL” error”](#invalid-redirect-url-error)
ArgoCD validates that `return_url` matches its configured URLs. Add your Cased CD URL to `additionalUrls`:
```bash
kubectl patch configmap argocd-cm -n argocd --type merge -p '
data:
additionalUrls: "https://cased-cd.example.com"
'
```
Note
You do **not** need to change the `url` setting in `argocd-cm`. It should continue pointing to your ArgoCD server. Only `additionalUrls` needs to include your Cased CD URL.
### CORS errors in browser console
[Section titled “CORS errors in browser console”](#cors-errors-in-browser-console)
Ensure Cased CD’s backend is properly proxying to ArgoCD. The frontend should not make direct requests to ArgoCD.
## Common Dex configurations
[Section titled “Common Dex configurations”](#common-dex-configurations)
### Okta via SAML
[Section titled “Okta via SAML”](#okta-via-saml)
```yaml
dex.config: |
connectors:
- type: saml
id: okta
name: Okta
config:
ssoURL: https://yourcompany.okta.com/app/xxx/sso/saml
caData:
redirectURI: https://argocd.example.com/api/dex/callback
usernameAttr: email
emailAttr: email
groupsAttr: groups
```
### Okta via OIDC
[Section titled “Okta via OIDC”](#okta-via-oidc)
```yaml
dex.config: |
connectors:
- type: oidc
id: okta
name: Okta
config:
issuer: https://yourcompany.okta.com
clientID: $dex.okta.clientID
clientSecret: $dex.okta.clientSecret
redirectURI: https://argocd.example.com/api/dex/callback
scopes:
- openid
- profile
- email
- groups
```
### GitHub
[Section titled “GitHub”](#github)
```yaml
dex.config: |
connectors:
- type: github
id: github
name: GitHub
config:
clientID: $dex.github.clientID
clientSecret: $dex.github.clientSecret
orgs:
- name: your-org
```
### LDAP
[Section titled “LDAP”](#ldap)
```yaml
dex.config: |
connectors:
- type: ldap
id: ldap
name: LDAP
config:
host: ldap.example.com:636
bindDN: cn=admin,dc=example,dc=com
bindPW: $dex.ldap.bindPW
userSearch:
baseDN: ou=users,dc=example,dc=com
username: uid
emailAttr: mail
groupSearch:
baseDN: ou=groups,dc=example,dc=com
userMatchers:
- userAttr: DN
groupAttr: member
```
## Groups and RBAC
[Section titled “Groups and RBAC”](#groups-and-rbac)
When using Dex, group membership flows through to ArgoCD RBAC. Configure your ArgoCD RBAC policies to use the group names from your identity provider:
```bash
kubectl patch configmap argocd-rbac-cm -n argocd --type merge -p '
data:
policy.csv: |
p, role:developer, applications, get, */*, allow
p, role:developer, applications, sync, */*, allow
p, role:admin, applications, *, */*, allow
g, developers, role:developer
g, platform-team, role:admin
'
```
See [Groups](/cased-cd/features/groups) for more details on RBAC configuration.
## Next steps
[Section titled “Next steps”](#next-steps)
* [Configure RBAC groups](/cased-cd/features/groups)
* [Set up audit trail](/cased-cd/features/audit-trail)
# Okta SSO
> Configure Okta single sign-on for Cased CD Enterprise
Configure Okta single sign-on for Cased CD Enterprise
This guide walks through setting up Okta as your identity provider for Cased CD Enterprise.
## Prerequisites
[Section titled “Prerequisites”](#prerequisites)
* Okta account with admin access
* Cased CD Enterprise deployed
* ArgoCD 2.0+
## Setup
[Section titled “Setup”](#setup)
1. **Create an Okta Application**
In your Okta Admin Console:
1. Navigate to **Applications** → **Applications**
2. Click **Create App Integration**
3. Select **OIDC - OpenID Connect**
4. Select **Single-Page Application**
5. Click **Next**
2. **Configure the application**
* **App integration name:** `Cased CD`
* **Grant type:** Authorization Code
* **Sign-in redirect URIs:** `https://cased-cd.example.com/auth/callback`
* **Sign-out redirect URIs:** `https://cased-cd.example.com/login`
* **Controlled access:** Select your assignment policy
For local development, also add `http://localhost:5173/auth/callback` to redirect URIs.
3. **Note your credentials**
After creating the app, note:
* **Client ID** (from the application’s General tab)
* **Okta domain** (e.g., `dev-123456.okta.com`)
4. **Configure ArgoCD**
```bash
kubectl patch configmap argocd-cm -n argocd --type merge -p '
data:
url: "https://cased-cd.example.com"
oidc.config: |
name: Okta
issuer: https://dev-123456.okta.com
clientID: YOUR_CLIENT_ID
requestedScopes: ["openid", "profile", "email", "groups"]
'
```
Note
Including the `groups` scope allows Okta group memberships to be passed to ArgoCD for RBAC.
5. **Restart ArgoCD**
```bash
kubectl rollout restart deployment argocd-server -n argocd
```
## Test the login
[Section titled “Test the login”](#test-the-login)
1. Navigate to your Cased CD login page
2. Click “Sign in with Okta”
3. Log in with your Okta credentials
4. You’ll be redirected back and logged in
## Configure groups
[Section titled “Configure groups”](#configure-groups)
### Create groups in Okta
[Section titled “Create groups in Okta”](#create-groups-in-okta)
1. In Okta Admin Console, go to **Directory** → **Groups**
2. Create groups like `cased-cd-admins`, `cased-cd-developers`
3. Assign users to groups
### Add groups claim to the application
[Section titled “Add groups claim to the application”](#add-groups-claim-to-the-application)
1. Go to **Applications** → **Cased CD** → **Sign On**
2. Click **Edit** in the OpenID Connect ID Token section
3. Add a groups claim:
* **Name:** `groups`
* **Include in token type:** ID Token, Always
* **Value type:** Filter
* **Filter:** Matches regex `.*` (or filter to specific groups)
### Configure ArgoCD RBAC
[Section titled “Configure ArgoCD RBAC”](#configure-argocd-rbac)
```bash
kubectl patch configmap argocd-rbac-cm -n argocd --type merge -p '
data:
policy.csv: |
p, role:developer, applications, get, */*, allow
p, role:developer, applications, sync, */*, allow
p, role:admin, applications, *, */*, allow
g, cased-cd-developers, role:developer
g, cased-cd-admins, role:admin
'
```
## Troubleshooting
[Section titled “Troubleshooting”](#troubleshooting)
### ”Invalid redirect\_uri” error
[Section titled “”Invalid redirect\_uri” error”](#invalid-redirect_uri-error)
Verify that:
1. The redirect URI in Okta matches your Cased CD URL exactly
2. Include the `/auth/callback` path
3. Protocol (http vs https) matches
### Groups not appearing
[Section titled “Groups not appearing”](#groups-not-appearing)
1. Verify the groups claim is configured in the Okta application
2. Check that users are assigned to groups in Okta
3. Ensure `groups` is in the `requestedScopes` in ArgoCD config
### ”unauthorized\_client” error
[Section titled “”unauthorized\_client” error”](#unauthorized_client-error)
1. Verify the Client ID is correct in ArgoCD config
2. Check that the application type is “Single-Page Application”
3. Ensure “Authorization Code” grant type is enabled
# SSO overview
> Configure single sign-on authentication for Cased CD Enterprise
Configure single sign-on authentication for Cased CD Enterprise
Cased CD Enterprise supports SSO authentication via OIDC providers, allowing your team to log in with their existing identity provider credentials.
## Supported providers
[Section titled “Supported providers”](#supported-providers)
[Existing Dex setup ](/cased-cd/authentication/sso-existing-dex)Already have ArgoCD + Dex? Start here
[AWS Cognito ](/cased-cd/authentication/sso-cognito)Direct OAuth with Authorization Code flow
[Okta ](/cased-cd/authentication/sso-okta)Standard OIDC integration
Auth0
Standard OIDC integration via ArgoCD
Azure AD
Standard OIDC integration via ArgoCD
Google
Standard OIDC integration via ArgoCD
Dex connectors
SAML, LDAP, GitHub, GitLab via Dex
## How it works
[Section titled “How it works”](#how-it-works)
Cased CD uses the **Authorization Code flow** for secure browser-based authentication:
1. User clicks “Sign in with \[Provider]” on the login page
2. Browser redirects to your identity provider
3. User authenticates with their credentials
4. Provider redirects back with an authorization code
5. Cased CD exchanges the code for tokens
6. User is logged in
Tip
Authorization Code flow is more secure than Implicit flow because tokens are never exposed in the browser URL.
## Basic authentication
[Section titled “Basic authentication”](#basic-authentication)
Cased CD also supports basic username/password authentication using ArgoCD’s built-in accounts:
```bash
# Get the admin password
kubectl -n argocd get secret argocd-initial-admin-secret \
-o jsonpath="{.data.password}" | base64 -d
```
Log in with:
* **Username:** `admin`
* **Password:** (from command above)
## SSO + groups
[Section titled “SSO + groups”](#sso--groups)
When using SSO, user group membership can be managed in your identity provider:
1. Create groups in your IdP (e.g., `developers`, `admins`)
2. Assign users to groups
3. Define RBAC policies for those groups in ArgoCD
4. Users inherit permissions from their groups automatically
See [Groups](/cased-cd/features/groups) for more details.
## Next steps
[Section titled “Next steps”](#next-steps)
* [Use existing Dex setup](/cased-cd/authentication/sso-existing-dex) - If you already have ArgoCD + Dex configured
* [Set up AWS Cognito SSO](/cased-cd/authentication/sso-cognito)
* [Set up Okta SSO](/cased-cd/authentication/sso-okta)
* [Configure RBAC groups](/cased-cd/features/groups)
# Configuration
> Configure Cased CD Enterprise to connect to ArgoCD
Configure Cased CD Enterprise to connect to ArgoCD
Cased CD Enterprise connects to your existing ArgoCD installation. This page covers the main configuration options.
## ArgoCD connection
[Section titled “ArgoCD connection”](#argocd-connection)
By default, Cased CD connects to ArgoCD at:
```plaintext
http://argocd-server.argocd.svc.cluster.local:80
```
If your ArgoCD uses a different namespace or service name, configure the `ARGOCD_SERVER` environment variable.
### Helm configuration
[Section titled “Helm configuration”](#helm-configuration)
values.yaml
```yaml
argocd:
server: "http://argocd-server.argocd.svc.cluster.local:80"
insecure: false # Set to true if ArgoCD uses self-signed certificates
```
Examples for different setups:
```yaml
# Different namespace
argocd:
server: "http://argocd-server.my-namespace.svc.cluster.local:80"
# Different service name
argocd:
server: "http://my-argocd.argocd.svc.cluster.local:80"
# External ArgoCD with TLS
argocd:
server: "https://argocd.example.com"
insecure: false
# Self-signed certificates
argocd:
server: "https://argocd-server.argocd.svc.cluster.local:443"
insecure: true
```
### kubectl configuration
[Section titled “kubectl configuration”](#kubectl-configuration)
Edit the deployment directly:
```bash
kubectl set env deployment/cased-cd-enterprise \
-n argocd \
ARGOCD_SERVER=https://argocd.example.com
```
## TLS and certificates
[Section titled “TLS and certificates”](#tls-and-certificates)
If ArgoCD uses self-signed or internal CA certificates, enable insecure mode:
```bash
helm upgrade cased-cd cased/cased-cd-enterprise \
--namespace argocd \
--set argocd.insecure=true
```
Caution
Only use `insecure: true` when ArgoCD is accessed over a trusted network. This skips TLS certificate verification.
## Audit trail storage
[Section titled “Audit trail storage”](#audit-trail-storage)
Configure the audit trail PVC size and storage class:
```bash
helm upgrade cased-cd cased/cased-cd-enterprise \
--namespace argocd \
--set enterprise.persistence.size=50Gi \
--set enterprise.persistence.storageClass=fast-ssd
```
Default size is 10GB, which supports approximately 20 million audit events.
### Disable persistent storage
[Section titled “Disable persistent storage”](#disable-persistent-storage)
For clusters without persistent storage, disable the audit trail PVC:
```bash
helm upgrade cased-cd cased/cased-cd-enterprise \
--namespace argocd \
--set enterprise.auditTrail.enabled=false
```
Audit events will still be logged to stdout and can be collected via your logging system.
## SSO configuration
[Section titled “SSO configuration”](#sso-configuration)
For SSO with AWS Cognito, configure the Cognito domain:
```bash
helm upgrade cased-cd cased/cased-cd-enterprise \
--namespace argocd \
--set cognito.domain=mycompany.auth.us-west-2.amazoncognito.com
```
See [SSO setup](/cased-cd/authentication/sso-overview) for complete instructions.
## All configuration options
[Section titled “All configuration options”](#all-configuration-options)
See the [environment variables reference](/cased-cd/reference/environment-variables) for a complete list of configuration options.
# Audit trail
> Complete action history with before/after change tracking
Complete action history with before/after change tracking
Cased CD Enterprise provides a comprehensive audit trail that records all actions taken in the system.
## What’s recorded
[Section titled “What’s recorded”](#whats-recorded)
Every action in Cased CD is logged with:
* **Who** — Username and user ID
* **What** — Action type and affected resource
* **When** — Timestamp with timezone
* **Where** — Source IP address
* **Details** — Before/after state for changes
### Tracked events
[Section titled “Tracked events”](#tracked-events)
| Category | Events |
| ------------------ | -------------------------------------------------------- |
| **Authentication** | Login attempts, logout, SSO flows, token refresh |
| **Applications** | Create, update, delete, sync, rollback, resource actions |
| **Clusters** | Add, update, remove clusters |
| **Repositories** | Add, update, remove repositories |
| **Projects** | Create, update, delete projects |
| **RBAC** | Role changes, permission updates |
| **Settings** | Configuration changes |
## Viewing the audit trail
[Section titled “Viewing the audit trail”](#viewing-the-audit-trail)
Navigate to **Settings** → **Audit Trail** in Cased CD to:
* Browse all events chronologically
* Filter by user, action type, or resource
* View detailed before/after diffs
* Export events for compliance
## Storage
[Section titled “Storage”](#storage)
Audit events are stored in a PersistentVolumeClaim:
```yaml
# Default configuration
enterprise:
persistence:
enabled: true
size: 10Gi
storageClass: "" # Uses cluster default
```
### Storage sizing
[Section titled “Storage sizing”](#storage-sizing)
| Events | Approximate storage |
| ---------- | ------------------- |
| 1 million | \~500 MB |
| 10 million | \~5 GB |
| 20 million | \~10 GB (default) |
### Custom storage class
[Section titled “Custom storage class”](#custom-storage-class)
```bash
helm upgrade cased-cd cased/cased-cd-enterprise \
--namespace argocd \
--set 'imagePullSecrets[0].name=cased-cd-registry' \
--set enterprise.persistence.size=50Gi \
--set enterprise.persistence.storageClass=fast-ssd
```
## Disable persistent storage
[Section titled “Disable persistent storage”](#disable-persistent-storage)
For clusters without persistent storage support, disable the audit PVC:
```bash
helm upgrade cased-cd cased/cased-cd-enterprise \
--namespace argocd \
--set 'imagePullSecrets[0].name=cased-cd-registry' \
--set enterprise.auditTrail.enabled=false
```
Note
When persistent storage is disabled, audit events are still logged to stdout. Use your cluster’s log aggregation system (Loki, CloudWatch, etc.) to retain audit logs.
## Log format
[Section titled “Log format”](#log-format)
Audit events are written as JSON lines:
```json
{
"timestamp": "2024-01-15T10:30:00Z",
"user": "alice@example.com",
"action": "sync",
"resource": "application",
"resourceName": "frontend",
"project": "default",
"sourceIP": "10.0.1.50",
"success": true,
"details": {
"revision": "abc123",
"prune": false
}
}
```
## Retention
[Section titled “Retention”](#retention)
Audit events are retained indefinitely within the storage allocation. To manage retention:
1. **Increase storage** — Scale the PVC for longer retention
2. **Export old events** — Use the export feature before cleanup
3. **Log aggregation** — Forward to external systems for long-term storage
## Compliance
[Section titled “Compliance”](#compliance)
The audit trail helps meet compliance requirements for:
* **SOC 2** — Access logging and change tracking
* **HIPAA** — Activity audit controls
* **PCI DSS** — Audit trail requirements
* **ISO 27001** — Information security event logging
## Forwarding to external systems
[Section titled “Forwarding to external systems”](#forwarding-to-external-systems)
Audit events logged to stdout can be collected by standard logging agents:
### Fluent Bit
[Section titled “Fluent Bit”](#fluent-bit)
```yaml
[INPUT]
Name tail
Path /var/log/containers/cased-cd-enterprise*.log
Parser json
[OUTPUT]
Name elasticsearch
Host elasticsearch.logging.svc
Index cased-cd-audit
```
### CloudWatch (EKS)
[Section titled “CloudWatch (EKS)”](#cloudwatch-eks)
With the CloudWatch agent installed, logs are automatically forwarded to CloudWatch Logs.
### Loki
[Section titled “Loki”](#loki)
```yaml
scrape_configs:
- job_name: cased-cd-audit
kubernetes_sd_configs:
- role: pod
relabel_configs:
- source_labels: [__meta_kubernetes_pod_label_app_kubernetes_io_name]
regex: cased-cd-enterprise
action: keep
```
# Groups
> Organize users into groups with inherited permissions
Organize users into groups with inherited permissions
Groups in Cased CD Enterprise allow you to organize users and assign permissions at the group level rather than individually.
## How groups work
[Section titled “How groups work”](#how-groups-work)
Groups can come from two sources:
1. **Identity Provider (IdP)** — Groups defined in your SSO provider (Cognito, Okta, etc.)
2. **ArgoCD local accounts** — Groups assigned to ArgoCD local users
When a user logs in, their group memberships are used to determine their permissions via ArgoCD’s RBAC system.
## Viewing groups
[Section titled “Viewing groups”](#viewing-groups)
Navigate to **Settings** → **Groups** in the Cased CD UI to see:
* All groups in your system
* Members of each group
* RBAC roles assigned to each group
## IdP group integration
[Section titled “IdP group integration”](#idp-group-integration)
### AWS Cognito
[Section titled “AWS Cognito”](#aws-cognito)
Cognito automatically includes groups in the `cognito:groups` claim:
```bash
# Create a group
aws cognito-idp create-group \
--user-pool-id us-west-2_XXXXXXXXX \
--group-name developers \
--region us-west-2
# Add user to group
aws cognito-idp admin-add-user-to-group \
--user-pool-id us-west-2_XXXXXXXXX \
--username user@example.com \
--group-name developers \
--region us-west-2
```
### Okta
[Section titled “Okta”](#okta)
Configure a groups claim in your Okta application:
1. Go to **Applications** → Your App → **Sign On**
2. Edit the OpenID Connect ID Token section
3. Add claim: `groups` with filter matching your groups
### Other providers
[Section titled “Other providers”](#other-providers)
Most OIDC providers support a `groups` claim. Consult your provider’s documentation for configuration details.
## RBAC configuration
[Section titled “RBAC configuration”](#rbac-configuration)
Map IdP groups to ArgoCD roles in `argocd-rbac-cm`:
```bash
kubectl patch configmap argocd-rbac-cm -n argocd --type merge -p '
data:
policy.csv: |
# Define roles
p, role:developer, applications, get, */*, allow
p, role:developer, applications, sync, */*, allow
p, role:admin, applications, *, */*, allow
p, role:admin, clusters, *, *, allow
p, role:admin, repositories, *, *, allow
# Map groups to roles
g, developers, role:developer
g, admins, role:admin
g, platform-team, role:admin
'
```
Tip
Group names in the RBAC policy must match exactly what your IdP sends in the groups claim.
## Common patterns
[Section titled “Common patterns”](#common-patterns)
### Team-based access
[Section titled “Team-based access”](#team-based-access)
Give each team access to their applications:
```csv
# Frontend team can manage frontend apps
p, role:frontend, applications, *, default/frontend-*, allow
g, frontend-team, role:frontend
# Backend team can manage backend apps
p, role:backend, applications, *, default/backend-*, allow
g, backend-team, role:backend
```
### Environment-based access
[Section titled “Environment-based access”](#environment-based-access)
Restrict production access:
```csv
# Developers can sync to staging
p, role:developer, applications, sync, staging/*, allow
# Only admins can sync to production
p, role:admin, applications, sync, production/*, allow
```
### Read-only access
[Section titled “Read-only access”](#read-only-access)
For stakeholders who need visibility:
```csv
p, role:viewer, applications, get, */*, allow
p, role:viewer, logs, get, */*, allow
g, stakeholders, role:viewer
```
## Troubleshooting
[Section titled “Troubleshooting”](#troubleshooting)
### Groups not appearing
[Section titled “Groups not appearing”](#groups-not-appearing)
1. **Check IdP configuration** — Verify groups claim is included in tokens
2. **Verify group membership** — Ensure users are assigned to groups in IdP
3. **Check ArgoCD logs** — Look for OIDC/groups-related errors
```bash
kubectl logs -n argocd deployment/argocd-server | grep -i group
```
### Permission denied despite group membership
[Section titled “Permission denied despite group membership”](#permission-denied-despite-group-membership)
1. **Case sensitivity** — Group names are case-sensitive
2. **Exact match** — Group name in RBAC must match IdP exactly
3. **Token refresh** — User may need to log out and back in
### Viewing user’s groups
[Section titled “Viewing user’s groups”](#viewing-users-groups)
Check a user’s effective groups via ArgoCD:
```bash
argocd account can-i sync applications '*' --as user@example.com
```
# RBAC
> Fine-grained role-based access control for applications
Fine-grained role-based access control for applications
Cased CD Enterprise provides a UI for managing ArgoCD’s role-based access control (RBAC) system.
## Overview
[Section titled “Overview”](#overview)
ArgoCD RBAC controls:
* **Who** can perform actions (users, groups)
* **What** actions they can perform (get, create, update, delete, sync)
* **On which** resources (applications, clusters, repositories, projects)
## Viewing RBAC
[Section titled “Viewing RBAC”](#viewing-rbac)
Navigate to **Settings** → **RBAC** in Cased CD to see:
* All defined roles and their permissions
* Which users and groups are assigned to each role
* Permission matrix showing access levels
## RBAC syntax
[Section titled “RBAC syntax”](#rbac-syntax)
ArgoCD uses a Casbin-based policy format:
```csv
# Permission: p, subject, resource, action, object, effect
p, role:developer, applications, get, */*, allow
# Group assignment: g, user/group, role
g, alice, role:developer
```
### Resources
[Section titled “Resources”](#resources)
| Resource | Description |
| -------------- | ------------------- |
| `applications` | ArgoCD applications |
| `clusters` | Kubernetes clusters |
| `repositories` | Git repositories |
| `projects` | ArgoCD projects |
| `accounts` | ArgoCD accounts |
| `certificates` | TLS certificates |
| `gpgkeys` | GPG signing keys |
| `logs` | Application logs |
| `exec` | Pod exec access |
### Actions
[Section titled “Actions”](#actions)
| Action | Description |
| ---------- | ------------------------- |
| `get` | View/read access |
| `create` | Create new resources |
| `update` | Modify existing resources |
| `delete` | Remove resources |
| `sync` | Sync applications |
| `override` | Override sync settings |
| `action` | Run resource actions |
| `*` | All actions |
### Object format
[Section titled “Object format”](#object-format)
Objects use the format `project/application`:
* `*/` — All projects, all applications
* `default/*` — All applications in default project
* `production/frontend` — Specific application
* `*/frontend-*` — Pattern matching
## Common roles
[Section titled “Common roles”](#common-roles)
### Administrator
[Section titled “Administrator”](#administrator)
Full access to everything:
```csv
p, role:admin, *, *, */*, allow
g, admin-team, role:admin
```
### Developer
[Section titled “Developer”](#developer)
Can view and sync applications:
```csv
p, role:developer, applications, get, */*, allow
p, role:developer, applications, sync, */*, allow
p, role:developer, logs, get, */*, allow
g, dev-team, role:developer
```
### Viewer
[Section titled “Viewer”](#viewer)
Read-only access:
```csv
p, role:viewer, applications, get, */*, allow
p, role:viewer, clusters, get, *, allow
p, role:viewer, repositories, get, *, allow
p, role:viewer, projects, get, *, allow
g, stakeholders, role:viewer
```
### Project-scoped developer
[Section titled “Project-scoped developer”](#project-scoped-developer)
Access limited to specific project:
```csv
p, role:frontend-dev, applications, get, frontend/*, allow
p, role:frontend-dev, applications, sync, frontend/*, allow
p, role:frontend-dev, logs, get, frontend/*, allow
g, frontend-team, role:frontend-dev
```
## Configuring RBAC
[Section titled “Configuring RBAC”](#configuring-rbac)
* kubectl
```bash
kubectl patch configmap argocd-rbac-cm -n argocd --type merge -p '
data:
policy.csv: |
p, role:developer, applications, get, */*, allow
p, role:developer, applications, sync, */*, allow
g, developers, role:developer
policy.default: role:readonly
'
```
* Helm
```yaml
# values.yaml for ArgoCD Helm chart
configs:
rbac:
policy.csv: |
p, role:developer, applications, get, */*, allow
p, role:developer, applications, sync, */*, allow
g, developers, role:developer
policy.default: role:readonly
```
## Default policy
[Section titled “Default policy”](#default-policy)
The `policy.default` setting determines permissions for authenticated users without explicit roles:
```csv
# Read-only access for everyone
policy.default: role:readonly
# No access by default (most restrictive)
policy.default: ""
```
Caution
Setting `policy.default: role:admin` gives all authenticated users admin access. Only use this for testing.
## Scopes
[Section titled “Scopes”](#scopes)
By default, ArgoCD checks the `groups` claim from OIDC tokens. Configure additional scopes:
```yaml
# argocd-rbac-cm
data:
scopes: "[groups, email]"
```
## Testing RBAC
[Section titled “Testing RBAC”](#testing-rbac)
Use the ArgoCD CLI to test permissions:
```bash
# Can user sync applications?
argocd account can-i sync applications '*' --as alice
# Can group deploy to production?
argocd account can-i sync applications 'production/*' --as-group developers
```
## Troubleshooting
[Section titled “Troubleshooting”](#troubleshooting)
### ”Permission denied” errors
[Section titled “”Permission denied” errors”](#permission-denied-errors)
1. Check user’s group membership in IdP
2. Verify RBAC policy syntax
3. Check ArgoCD server logs for policy evaluation
```bash
kubectl logs -n argocd deployment/argocd-server | grep -i rbac
```
### Changes not taking effect
[Section titled “Changes not taking effect”](#changes-not-taking-effect)
ArgoCD caches RBAC policies. Restart the server to force reload:
```bash
kubectl rollout restart deployment argocd-server -n argocd
```
# Installation
> Deploy Cased CD Enterprise to your Kubernetes cluster
Deploy Cased CD Enterprise to your Kubernetes cluster
Cased CD Enterprise deploys alongside your existing ArgoCD installation, providing a modern UI with enterprise features.
## Prerequisites
[Section titled “Prerequisites”](#prerequisites)
* Existing ArgoCD installation (v2.0+)
* Kubernetes cluster with kubectl access
* Default StorageClass for audit log PVC (or disable persistent audit logging)
* Enterprise registry credentials from [app.cased.com](https://app.cased.com)
## Quick install
[Section titled “Quick install”](#quick-install)
The interactive installer handles prerequisites, authentication, and deployment:
```bash
curl -fsSL https://cased.github.io/cased-cd-enterprise/install.sh | bash
```
## Manual installation
[Section titled “Manual installation”](#manual-installation)
1. **Create registry credentials**
The enterprise image requires authentication. Sign up at [app.cased.com](https://app.cased.com) to receive your registry token.
```bash
kubectl create secret docker-registry cased-cd-registry \
--docker-server=registry.cased.com \
--docker-username=token \
--docker-password="YOUR_REGISTRY_TOKEN" \
--namespace=argocd
```
2. **Deploy with Helm (recommended)**
```bash
# Add the Cased Helm repository
helm repo add cased https://cased.github.io/cased-cd-enterprise
helm repo update
# Install Cased CD Enterprise
helm install cased-cd cased/cased-cd-enterprise \
--namespace argocd \
--set 'imagePullSecrets[0].name=cased-cd-registry'
```
Or **deploy with kubectl**:
```bash
kubectl apply -f https://cased.github.io/cased-cd-enterprise/install-enterprise.yaml
```
3. **Access the UI**
```bash
kubectl port-forward -n argocd svc/cased-cd-enterprise 8080:80
```
Open `http://localhost:8080` and log in with your ArgoCD credentials.
## Installation options
[Section titled “Installation options”](#installation-options)
* Full install
Includes persistent audit trail storage (requires StorageClass):
```bash
helm install cased-cd cased/cased-cd-enterprise \
--namespace argocd \
--set 'imagePullSecrets[0].name=cased-cd-registry'
```
Or with kubectl:
```bash
kubectl apply -f https://cased.github.io/cased-cd-enterprise/install-enterprise.yaml
```
* Minimal install
For clusters without a default StorageClass (Talos, bare-metal):
```bash
helm install cased-cd cased/cased-cd-enterprise \
--namespace argocd \
--set 'imagePullSecrets[0].name=cased-cd-registry' \
--set enterprise.auditTrail.enabled=false
```
Or with kubectl:
```bash
kubectl apply -f https://cased.github.io/cased-cd-enterprise/install-enterprise-minimal.yaml
```
Note
Audit events are still logged to stdout and can be collected via your log aggregation system.
## Storage configuration
[Section titled “Storage configuration”](#storage-configuration)
The audit trail uses a PersistentVolumeClaim. Common storage classes by platform:
| Platform | Storage classes |
| ---------- | ---------------------------- |
| AWS EKS | `gp2`, `gp3` |
| Google GKE | `standard`, `standard-rwo` |
| Azure AKS | `default`, `managed-premium` |
| k3d/k3s | `local-path` |
Specify a storage class explicitly:
```bash
helm install cased-cd cased/cased-cd-enterprise \
--namespace argocd \
--set 'imagePullSecrets[0].name=cased-cd-registry' \
--set enterprise.persistence.storageClass=gp3
```
## Ingress configuration
[Section titled “Ingress configuration”](#ingress-configuration)
Expose Cased CD externally:
```bash
helm upgrade cased-cd cased/cased-cd-enterprise \
--namespace argocd \
--set 'imagePullSecrets[0].name=cased-cd-registry' \
--set ingress.enabled=true \
--set ingress.className=nginx \
--set 'ingress.hosts[0].host=cased-cd.example.com' \
--set 'ingress.hosts[0].paths[0].path=/' \
--set 'ingress.hosts[0].paths[0].pathType=Prefix'
```
## Verify deployment
[Section titled “Verify deployment”](#verify-deployment)
```bash
# Check pods are running
kubectl get pods -n argocd -l app.kubernetes.io/name=cased-cd-enterprise
# Check audit PVC was created (full install only)
kubectl get pvc -n argocd -l app.kubernetes.io/component=enterprise
# View enterprise backend logs
kubectl logs -n argocd deployment/cased-cd-enterprise -f
```
## What gets deployed
[Section titled “What gets deployed”](#what-gets-deployed)
* **Cased CD frontend** — Static React app served by nginx
* **Enterprise backend** — Go service for RBAC, audit, notifications, user management
* **PersistentVolumeClaim** — 10GB storage for audit logs (full install)
* **RBAC roles** — Kubernetes permissions for ConfigMap/Secret access
## Next steps
[Section titled “Next steps”](#next-steps)
* [Configure ArgoCD connection](/cased-cd/configuration)
* [Set up SSO authentication](/cased-cd/authentication/sso-overview)
* [Configure RBAC groups](/cased-cd/features/groups)
# Environment variables
> Complete reference for Cased CD Enterprise configuration options
Complete reference for Cased CD Enterprise configuration options
This page documents all environment variables that configure Cased CD Enterprise.
## ArgoCD connection
[Section titled “ArgoCD connection”](#argocd-connection)
| Variable | Description | Default |
| ------------------ | ----------------------------------- | -------------------------------------------------- |
| `ARGOCD_SERVER` | ArgoCD server URL | `http://argocd-server.argocd.svc.cluster.local:80` |
| `ARGOCD_INSECURE` | Skip TLS certificate verification | `false` |
| `ARGOCD_NAMESPACE` | Namespace where ArgoCD is installed | `argocd` |
### Examples
[Section titled “Examples”](#examples)
```bash
# Internal cluster connection
ARGOCD_SERVER=http://argocd-server.argocd.svc.cluster.local:80
# External with TLS
ARGOCD_SERVER=https://argocd.example.com
ARGOCD_INSECURE=false
# Self-signed certificates
ARGOCD_SERVER=https://argocd-server.argocd.svc.cluster.local:443
ARGOCD_INSECURE=true
```
## SSO configuration
[Section titled “SSO configuration”](#sso-configuration)
| Variable | Description | Default |
| ---------------- | ---------------------------- | ------- |
| `COGNITO_DOMAIN` | AWS Cognito hosted UI domain | — |
Note
SSO configuration is primarily done via ArgoCD’s OIDC settings in `argocd-cm` ConfigMap. The `COGNITO_DOMAIN` variable is only needed for AWS Cognito’s Authorization Code flow.
### Cognito example
[Section titled “Cognito example”](#cognito-example)
```bash
# Format: your-domain.auth.region.amazoncognito.com
COGNITO_DOMAIN=mycompany.auth.us-west-2.amazoncognito.com
```
## Audit trail
[Section titled “Audit trail”](#audit-trail)
| Variable | Description | Default |
| ----------------- | ---------------------------- | -------------------------- |
| `AUDIT_FILE_PATH` | Path to audit log file | `/data/audit/events.jsonl` |
| `AUDIT_ENABLED` | Enable/disable audit logging | `true` |
## Frontend configuration
[Section titled “Frontend configuration”](#frontend-configuration)
These variables are set at build time via Vite:
| Variable | Description | Default |
| ------------------------- | ------------------------------- | ------- |
| `VITE_IS_ENTERPRISE` | Enable enterprise features | `false` |
| `VITE_USE_REAL_API` | Use real ArgoCD API vs mock | `false` |
| `VITE_COGNITO_DOMAIN` | Cognito domain for frontend SSO | — |
| `VITE_ENTERPRISE_BACKEND` | Use enterprise backend | `false` |
Caution
`VITE_*` variables are embedded at build time. For runtime configuration, use the backend environment variables or Helm values.
## Helm values mapping
[Section titled “Helm values mapping”](#helm-values-mapping)
These environment variables can also be set via Helm values:
| Environment variable | Helm value |
| -------------------- | ------------------------------- |
| `ARGOCD_SERVER` | `argocd.server` |
| `ARGOCD_INSECURE` | `argocd.insecure` |
| `ARGOCD_NAMESPACE` | `argocd.namespace` |
| `COGNITO_DOMAIN` | `cognito.domain` |
| `AUDIT_ENABLED` | `enterprise.auditTrail.enabled` |
### Helm example
[Section titled “Helm example”](#helm-example)
```bash
helm upgrade cased-cd cased/cased-cd-enterprise \
--namespace argocd \
--set 'imagePullSecrets[0].name=cased-cd-registry' \
--set argocd.server=https://argocd.example.com \
--set argocd.insecure=false \
--set cognito.domain=mycompany.auth.us-west-2.amazoncognito.com
```
## Setting variables manually
[Section titled “Setting variables manually”](#setting-variables-manually)
### Via kubectl
[Section titled “Via kubectl”](#via-kubectl)
```bash
kubectl set env deployment/cased-cd-enterprise \
-n argocd \
ARGOCD_SERVER=https://argocd.example.com \
ARGOCD_INSECURE=false
```
### Via deployment patch
[Section titled “Via deployment patch”](#via-deployment-patch)
```bash
kubectl patch deployment cased-cd-enterprise -n argocd --type json -p '[
{
"op": "add",
"path": "/spec/template/spec/containers/0/env/-",
"value": {
"name": "COGNITO_DOMAIN",
"value": "mycompany.auth.us-west-2.amazoncognito.com"
}
}
]'
```
## Debugging
[Section titled “Debugging”](#debugging)
View current environment variables:
```bash
kubectl exec -n argocd deployment/cased-cd-enterprise -- env | sort
```
Check if variables are being used:
```bash
kubectl logs -n argocd deployment/cased-cd-enterprise | head -50
```
# Changelog
> Latest updates and improvements
Latest updates and improvements
Jan 19 2026
### CLI web authentication
Authenticate the Cased CLI through your browser
The **Cased CLI** now supports web-based authentication for easier setup.
## What’s new
* **Device code flow** - Run `cased configure`, enter the code in your browser, done
* **Automatic token handling** - Tokens are securely stored in `~/.config/cased/`
* **SSO support** - Works with your existing SSO provider
* **SSH-friendly** - Copy the URL if browser doesn’t open automatically
[Learn more about CLI authentication →](/cli)
Jan 18 2026
### LLM Monitoring
Track LLM usage, costs, and latency across your applications
Cased Telemetry now includes **LLM monitoring** - track token usage, costs, and latency across all your AI integrations.
## What’s new
* **Token tracking** - Monitor input, output, and cached tokens per model
* **Cost estimates** - Automatic cost calculation for major providers (OpenAI, Anthropic, Google, etc.)
* **Latency percentiles** - Track p50, p95, p99 latencies by model
* **Session grouping** - Group multi-turn conversations and trace related calls
* **CLI commands** - `cased llm usage`, `cased llm cost`, `cased llm latency`
[Learn more about LLM monitoring →](/telemetry/llm-monitoring)
Jan 18 2026
### Performance analysis
Analyze distributed traces to find slow spans, N+1 queries, and regressions
New **performance analysis** tools for distributed traces in Cased Telemetry.
## What’s new
* **Find slow spans** - Identify operations exceeding latency thresholds
* **N+1 detection** - Automatically detect repeated query patterns
* **Regression detection** - Compare recent performance against baseline periods
* **Trace breakdown** - Detailed service-by-service analysis of slow traces
* **CLI commands** - `cased perf slow`, `cased perf n1`, `cased perf regression`
[Learn more about traces →](/telemetry/traces)
Jan 18 2026
### Source maps
De-minify JavaScript stack traces with source map support
Cased Telemetry now supports **source maps** for JavaScript stack trace de-minification.
## What’s new
* **Automatic de-minification** - Minified stack traces are mapped back to original source
* **Upload via CLI** - `cased sourcemaps upload` to upload maps during your build
* **Release tracking** - Associate source maps with specific releases
[Learn more about source maps →](/telemetry/source-maps)
Jan 15 2026
### Improved agent reliability
Major improvements to agent performance and reliability
A major upgrade to agent performance and reliability.
## What’s new
* **Faster execution** - Agents run asynchronously for better performance
* **Better debugging** - All agent events are stored for replay and inspection
* **Structured outputs** - More reliable and predictable agent responses
* **Improved error handling** - Better recovery from tool failures and timeouts
Jan 12 2026
### Cased Telemetry
AI-native observability - errors, metrics, and traces for agents
Introducing **Cased Telemetry** - AI-native observability built for agents, not dashboards.
## What’s new
* **Sentry SDK compatible** - Use the standard sentry-sdk, just change the DSN
* **cased-agent for metrics** - Deploy a DaemonSet to collect container metrics from Kubernetes
* **eBPF HTTP tracing** - Automatic request tracing without code changes
* **CLI and API access** - Query your telemetry from the terminal or programmatically
There’s no Cased Telemetry dashboard. The API is the interface, and AI agents are the users.
[Learn more about Cased Telemetry →](/telemetry/overview)
Jan 7 2026
### Anthropic Tool Search API
Smarter tool selection using Anthropic's Tool Search API
Agents now use **Anthropic’s Tool Search API** for smarter tool selection.
## What’s new
* **Semantic tool matching** - Tools are selected based on meaning, not just keywords
* **Reduced context usage** - Only relevant tools are included in agent context
* **Better tool combinations** - Agents can find complementary tools more effectively
Jan 7 2026
### Voice interviews for architecture capture
Capture team knowledge through voice conversations with AI
A new way to capture institutional knowledge: **voice interviews** with AI.
## What’s new
* **Voice-based knowledge capture** - Talk through your architecture decisions naturally
* **Automatic transcription** - Conversations are transcribed and indexed
* **Searchable knowledge base** - Architecture decisions become queryable context for agents
Jan 5 2026
### Floating and collapsed chat
New chat modes for flexible workspace layouts
The chat interface now supports **floating** and **collapsed** modes for more flexible workspace layouts.
## What’s new
* **Floating mode** - Drag the chat anywhere on screen while working
* **Collapsed mode** - Minimize the chat to a small icon to maximize workspace
* **Persistent state** - Your preferred layout is remembered across sessions
Dec 22 2025
### Workflow notifications
Get notified when workflows complete via Slack or email
Workflows can now send **Slack and email notifications** when they complete.
## What’s new
* **Slack notifications** - Get notified in your team channels when workflows finish
* **Email notifications** - Receive email summaries of workflow results
* **Configurable per workflow** - Enable notifications for the workflows that matter most
Dec 12 2025
### PR summarize
Get AI-generated summaries of pull requests by mentioning @cased
You can now get AI-generated summaries of pull requests by mentioning **@cased summarize** in a PR comment.
## What’s new
* **Automatic PR analysis** - Summarizes code changes, identifies risks, and highlights key decisions
* **Discussion-focused** - Summarizes the conversation and context, not just the diff
* **GitHub integration** - Works directly in your PR workflow via mentions
Dec 9 2025
### AI code writing
Agents can now write and execute code in sandboxed environments
Agents can now **write and execute code** in isolated sandbox environments.
## What’s new
* **Sandboxed execution** - Code runs in secure, isolated environments
* **Multi-language support** - Python, TypeScript, and JavaScript
* **Automatic formatting** - Code is automatically formatted
* **Test generation** - Agents write tests alongside implementation
This enables agents to implement fixes, generate reports, and build tools autonomously.
Dec 1 2025
### Groundcover Integration
eBPF-based Kubernetes observability with automated cluster monitoring and incident investigation
We’ve integrated **Groundcover**, an eBPF-based Kubernetes observability platform, enabling automated cluster monitoring and incident investigation.
## What’s new
* **List clusters and namespaces** - Query your Kubernetes infrastructure
* **Query workloads with metrics** - Analyze resource usage and performance
* **Automatic error analysis** - When alerts fire, agents automatically investigate common issues like resource exhaustion and configuration errors
No more switching between multiple dashboards to diagnose Kubernetes problems.
[Learn more about Groundcover integration →](/integrations/groundcover)
Dec 1 2025
### Render Webhook Triggers
Automated workflow responses to Render deployment and service events
Render webhooks can now trigger Cased workflows automatically.
## What’s new
* **Deployment event triggers** - Automatically investigate deployment failures
* **Service event monitoring** - Respond to outages and scaling events
* **Enhanced metrics querying** - Query CPU, memory, HTTP latency, and database health
Connect your Render account and let agents handle deployment issues automatically.
[Learn more about Render integration →](/integrations/render)
Nov 18 2025
### Honeycomb Integration
Query traces, metrics, and deployment data from Honeycomb during incident investigation
We’ve integrated **Honeycomb** observability data into Cased, enabling agents to analyze incidents with full trace and metric context.
## What’s new
* **Natural language queries** - Ask about error rates, latency, and system performance
* **Deployment correlation** - Automatically correlate issues with recent deployments
* **Alert visibility** - See configured alerts and notification channels to identify monitoring gaps
[Learn more about Honeycomb integration →](/integrations/honeycomb)
Nov 17 2025
### CloudWatch Alarms Configuration
Configure CloudWatch alarms through natural language without opening the AWS console
Configure AWS CloudWatch alarms through Cased without navigating the AWS console.
## What’s new
* **Natural language alarm creation** - Describe what you want to monitor
* **Automatic metric selection** - Agent finds the right metrics and thresholds
* **SNS integration** - Set up notifications to Slack, email, or PagerDuty
Skip the AWS console clicks and let the agent handle alarm configuration.
Sep 24 2025
### PagerDuty Incident Triggers
Trigger workflows automatically from PagerDuty incidents
PagerDuty incidents can now trigger Cased workflows automatically.
## What’s new
* **Zero config setup** - Automatic webhook subscription creation
* **Multiple trigger types** - Incident creation, acknowledgment, and resolution
* **Automated response** - Run diagnostics, execute remediation, create post-mortems
Connect PagerDuty and let agents start investigating before you even look at the alert.
[Learn more about PagerDuty integration →](/integrations/pagerduty)
Sep 24 2025
### PostHog Analytics Integration
Query product analytics and user behavior data from PostHog
We’ve integrated **PostHog** product analytics, giving agents access to user behavior and feature usage data.
## What’s new
* **Query user behavior** - Understand how users interact with features
* **Analyze feature adoption** - Track rollout success and usage patterns
* **Correlate with infrastructure** - Connect product metrics to system performance
[Learn more about PostHog integration →](/integrations/posthog)
Sep 24 2025
### Render Integration
Monitor and manage Render deployments through AI agents
We’ve launched a **Render** integration for teams deploying on Render’s cloud platform.
## What’s new
* **Automatic deployment tracking** - Monitor builds and service health
* **Natural language queries** - Ask about your infrastructure in plain English
* **Automatic issue detection** - Watch for deployment failures and performance problems
* **Suggested responses** - Get recommendations for rollbacks or scaling adjustments
[Learn more about Render integration →](/integrations/render)
Sep 15 2025
### ArgoCD Integration
Monitor Kubernetes deployments with ArgoCD sync status and health tracking
We’ve integrated **ArgoCD** for teams using GitOps-based Kubernetes deployments.
## What’s new
* **Automatic deployment tracking** - Sync status changes, application health, resource metadata
* **Slack/email notifications** - Get notified of deployment changes
* **AI-powered issue response** - Agents investigate sync failures and health issues
* **Complete audit trail** - Full history of all deployment events
[Learn more about ArgoCD integration →](/integrations/argocd)
Sep 5 2025
### CloudFormation Support
Infrastructure management for AWS CloudFormation stacks
Cased now supports **AWS CloudFormation** alongside Terraform and Pulumi.
## What’s new
* **Automated stack scanning** - Detect configuration drift in your stacks
* **Drift remediation** - Generate fixes through pull requests
* **Unified monitoring** - Single view across Terraform, Pulumi, and CloudFormation
Teams using AWS’s native IaC tool can now get the same automated management as Terraform users.
Aug 29 2025
### Deploy Monitoring in Slack
Real-time deployment updates and monitoring directly in Slack
Deploy monitoring now posts updates directly to your Slack channels.
## What’s new
* **Real-time updates** - See deployment progress as it happens
* **Error alerts** - Get notified of failures with Sentry links
* **Post-deploy monitoring** - 30-minute health check after deployment completes
* **Rollback suggestions** - Automatic recommendations when issues are detected
Keep your team informed without leaving Slack.
Aug 27 2025
### Custom Workflows
Create your own automated workflows tailored to your infrastructure needs
You can now create **custom workflows** tailored to your organization’s specific needs.
## What’s new
* **Custom prompts** - Write instructions for exactly what you want automated
* **Flexible triggers** - Schedule, webhook, or API triggers
* **Integration access** - Use any connected integration in your workflows
* **Parameter templates** - Make workflows reusable across environments
Start with our default workflows or build your own from scratch.
[Learn more about custom workflows →](/agents/custom-agents)
Aug 20 2025
### Pulumi Support
Infrastructure management for Pulumi stacks with drift detection and code generation
Cased now supports **Pulumi** alongside Terraform for infrastructure-as-code management.
## What’s new
* **Drift detection** - Scan Pulumi stacks for configuration drift
* **Automatic fixes** - Generate pull requests with remediation
* **Code generation** - Write new Pulumi code in TypeScript, Python, or Go
* **Resource management** - Query and manage Pulumi resources
One agent for all your IaC needs, regardless of which tool you use.
Aug 19 2025
### Agent API
Programmatic access to Cased agents for custom integrations and automation
We’ve launched the **Cased Agent API** for programmatic access to agents.
## What’s new
* **Start sessions** - Create agent sessions via API
* **Trigger workflows** - Run workflows programmatically
* **Query status** - Check session and workflow run status
* **Integrate anywhere** - Build Cased into your existing tools and scripts
[View API documentation →](/api/public-api)
Aug 13 2025
### Infrastructure Cost Analysis Workflow
Automated AWS cost analysis that identifies optimization opportunities and tracks spending patterns
The **Infrastructure Cost Analysis** workflow monitors your AWS spending and identifies cost optimization opportunities with specific dollar savings potential.
This workflow examines actual cloud usage to find oversized instances, unused resources, inefficient storage, and opportunities for Reserved Instances. Each finding includes current monthly costs, potential savings, implementation steps, and risk assessment.
Configure daily analysis for active cost management or weekly for standard monitoring. Results can be delivered to Slack channels or viewed in your dashboard.
Key findings:
* **Right-sizing**: Identifies oversized EC2 instances and over-provisioned databases
* **Waste elimination**: Finds idle resources, orphaned volumes, and redundant snapshots
* **Storage optimization**: Recommends lifecycle policies and storage class changes
* **Reserved capacity**: Highlights opportunities for Reserved Instances and Savings Plans
[Learn more about the workflow →](/agents/default-agents)
Aug 13 2025
### Introducing Workflows
Automated AI workflows that continuously monitor your infrastructure and codebase for issues
We’re excited to introduce **Workflows** - automated AI processes that provide 24/7 monitoring and analysis for your infrastructure operations.
Workflows run on schedules you define (daily, weekly, monthly) or trigger automatically from external events like Sentry errors or deployments. Each workflow uses AI to analyze your systems, identify issues, and can start other workflows to fix problems.
## Launch workflows
* **SOC2 Compliance**: Automated compliance scanning 🛡️
* **Infrastructure Cost Analysis**: Cost optimization opportunities 💰
* **Terraform Security Analysis**: Security vulnerability detection 🔒
* **Terraform Best Practices**: Code quality and maintainability 📋
* **Sentry Error Analyzer**: Automatic error resolution 🚨
* **Deploy Monitor**: Deployment health tracking 🚀
Configure workflows in your dashboard to run autonomously while you focus on building.
[Learn more about workflows →](/agents/overview)
Aug 13 2025
### Sentry Error Analyzer Workflow
Automatically analyze Sentry errors and start resolution sessions with AI-powered root cause analysis
The **Sentry Error Analyzer** workflow automatically analyzes new Sentry issues and works to solve problems in separate sessions.
When Sentry webhooks notify of new errors, this workflow immediately examines the error message, stack trace, and relevant code to identify root causes and create actionable resolution steps. It handles runtime errors, import failures, configuration issues, database problems, and API integration failures.
Key features:
* **Automatic triggering**: No setup required beyond Sentry integration
* **Repository mapping**: Links errors to correct codebases intelligently
* **Priority assessment**: Assigns critical/high/medium/low based on impact
* **Action items**: Specific steps for developers to resolve issues
Install the public “cased” Sentry integration to enable automatic error analysis.
[Learn more about the workflow →](/agents/default-agents)
Aug 13 2025
### Terraform Best Practices Workflow
Automated Terraform code quality analysis for maintainability, module design, and best practices
The **Terraform Best Practices** workflow reviews your infrastructure-as-code for quality, maintainability, and adherence to Terraform best practices.
This workflow analyzes code organization, naming conventions, module design, documentation quality, and version management. It identifies opportunities to improve code reusability, consistency, and long-term maintainability of your infrastructure definitions.
Schedule weekly reviews for standard development or configure custom directories for targeted analysis. Integrate with GitHub to automatically review pull requests.
Key areas analyzed:
* **Code organization**: Module structure and file organization improvements
* **Naming conventions**: Consistent resource naming and tagging strategies
* **Documentation**: Missing variable descriptions and module documentation
* **Version management**: Provider constraints and module versioning best practices
[Learn more about the workflow →](/agents/default-agents)
Aug 13 2025
### Terraform Cost Optimization Workflow
Automated analysis of Terraform code for cost optimization opportunities and financial efficiency
The **Terraform Cost Optimization** workflow analyzes your infrastructure-as-code to identify cost optimization opportunities before resources are deployed.
This workflow examines Terraform configurations for oversized resources, expensive storage configurations, inefficient networking setups, and missed opportunities for Reserved Instances or Savings Plans. It provides cost estimates and specific recommendations to reduce spending.
Configure weekly analysis to catch cost issues during development or run on-demand before major deployments. Target specific directories containing your most expensive infrastructure.
Key optimizations identified:
* **Resource sizing**: Oversized EC2 instances, RDS databases, and storage allocations
* **Storage efficiency**: Expensive storage classes and redundant backup configurations
* **Network costs**: Data transfer optimization and NAT Gateway efficiency
* **Reserved capacity**: Opportunities to use Reserved Instances and Savings Plans
[Learn more about the workflow →](/agents/default-agents)
Aug 13 2025
### Terraform Operational Excellence Workflow
Automated analysis of Terraform code for monitoring, disaster recovery, and operational reliability
The **Terraform Operational Excellence** workflow analyzes your infrastructure-as-code for operational reliability, monitoring coverage, and disaster recovery preparedness.
This workflow examines Terraform configurations to ensure proper CloudWatch alarms, backup strategies, multi-AZ deployments, and monitoring setups. It identifies gaps in operational readiness and provides specific recommendations for improved reliability.
Schedule weekly analysis to maintain operational standards or run before major infrastructure changes. Configure specific directories to focus on critical production systems.
Key areas analyzed:
* **Monitoring setup**: Missing CloudWatch alarms and logging configurations
* **High availability**: Single-AZ deployments and missing failover mechanisms
* **Backup strategies**: Inadequate backup configurations and retention policies
* **Disaster recovery**: Missing cross-region replication and recovery procedures
[Learn more about the workflow →](/agents/default-agents)
Aug 13 2025
### Terraform Security Analysis Workflow
Automated security analysis of Terraform code for vulnerabilities, authentication issues, and data protection
The **Terraform Security Analysis** workflow scans your infrastructure-as-code for security vulnerabilities before they reach production.
This workflow examines Terraform configurations to identify overly permissive IAM policies, unencrypted resources, public exposures, weak authentication, and network security gaps. It provides exact file locations, risk assessments, and specific remediation code for each finding.
Schedule it daily for active development or weekly for standard security reviews. Configure specific directories to analyze and integrate with GitHub for automatic scanning.
Key capabilities:
* **Access control analysis**: Identifies overprivileged resources and policies
* **Encryption gaps**: Finds unencrypted storage and data transfer vulnerabilities
* **Network security**: Detects VPC misconfigurations and firewall gaps
* **Compliance mapping**: Links findings to SOC2 and ISO27001 requirements
[Learn more about the workflow →](/agents/default-agents)
Aug 12 2025
### SOC2 Compliance Workflow
Automated SOC2 compliance analysis workflow that scans Terraform code and AWS resources for violations
The SOC2 Compliance workflow automatically scans your infrastructure to identify SOC2 compliance violations in both your Terraform code and live AWS resources.
This workflow analyzes your infrastructure for common compliance issues including:
* **Encryption gaps**: Unencrypted S3 buckets, EBS volumes, and RDS instances
* **Excessive permissions**: Overly broad IAM policies and public access configurations
* **Missing logging**: Lack of CloudTrail, VPC Flow Logs, or application logging
* **Backup failures**: Missing backup configurations for critical data
* **Public access**: Resources exposed to the internet without proper controls
* **Configuration drift**: Differences between Terraform definitions and actual AWS state
The workflow examines Terraform files in your repositories using GitHub integration, then validates actual AWS resource configurations through your connected AWS accounts. It identifies specific violations with exact file paths, line numbers, and AWS resource ARNs.
Each finding includes:
* SOC2 control mapping (CC6, CC7, CC8, CC9)
* Severity level (critical, high, medium, low)
* Remediation steps with corrected Terraform code
* Audit-ready documentation for compliance reviews
Configure the workflow to run weekly, daily, or on infrastructure changes. Results can be delivered to designated Slack channels with customizable severity thresholds.
Aug 2 2025
### Infrastructure Graph Visualization
Visualize your AWS infrastructure with interactive dependency graphs
Understanding complex infrastructure relationships is easier with our new infrastructure graph visualization.
## What’s New
### Interactive Infrastructure Graphs
* **Visual Topology**: See your entire AWS infrastructure as an interactive graph
* **Resource Relationships**: Understand dependencies between resources at a glance
* **Zoom & Pan**: Navigate large infrastructure deployments with ease
* **Dark Mode Support**: Graphs adapt to your theme preference
### Smart Filtering
* Filter by resource type (EC2, RDS, Lambda, etc.)
* Show/hide specific relationships
* Focus on particular availability zones or regions
### Real-time Updates
* Graphs update automatically as infrastructure changes
* See deployment impacts visually
* Track drift between desired and actual state
### Integration with Agents
* Ask agents to explain specific parts of your infrastructure
* Get recommendations based on graph analysis
* Identify potential issues through visual inspection
## Use Cases
* **Architecture Reviews**: Quickly understand system design
* **Troubleshooting**: Trace dependencies when debugging issues
* **Cost Analysis**: Identify resource clusters and optimization opportunities
* **Security Audits**: Visualize network boundaries and access patterns
Aug 1 2025
### Dynamic Data Visualization
Agents can now create custom, interactive data visualizations to better communicate insights
We’ve enhanced our agents with powerful data visualization capabilities. Agents can now generate custom, interactive charts and graphs on-the-fly to help you better understand your data.
## What’s New
* **Custom Visualizations**: Agents dynamically create React components with D3.js for tailored visualizations
* **Interactive Charts**: Full interactivity including hover tooltips, zoom, and pan capabilities
* **Multiple Chart Types**: Support for line charts, bar charts, scatter plots, and more
* **Real-time Rendering**: Visualizations render instantly within agent responses
* **Data-Driven Insights**: Agents choose the best visualization type based on your data
## How It Works
When analyzing data, agents can now create visualizations that best represent the insights they discover.
This feature is automatically available in all agent sessions - just ask your agent to visualize any data.
Jul 25 2025
### Enhanced Agent List View
New table view for agents with advanced filtering, status indicators, and improved organization
We’ve redesigned the agent list view to make it easier to manage and track your AI agents.
## Key Improvements
### Organized Views
* **Inbox Tab**: Active agents (Running, Paused, Failed)
* **Archived Tab**: Completed and archived agent sessions
* **Smart Filtering**: Filter by status to focus on what matters
### Visual Status Indicators
* 🟢 **Running**: Active agents with pulsing green indicator
* 🟡 **Paused**: Agents waiting for input with yellow indicator
* 🔴 **Failed**: Agents that encountered errors with red indicator
* ⚪ **Archived**: Completed sessions with gray indicator
### Enhanced Information Display
* **User Avatars**: See who started each agent session
* **Workflow Badges**: Easily identify workflow-triggered agents
* **Last Activity**: Real-time updates showing when agents were last active
* **Quick Actions**: Archive or manage agents directly from the list
### Performance
* Optimized for handling hundreds of agent sessions
* Real-time updates without page refreshes
* Smooth animations and transitions
Jul 19 2025
### Changelog Started
This is the start of the changelog.
Going forward, we’ll use this space to share:
* **New features** - The latest capabilities and integrations we’ve added to Cased
* **Improvements** - Enhancements to existing functionality based on your feedback
* **Bug fixes** - Important fixes that improve stability and reliability
* **Performance updates** - Optimizations that make Cased faster and more efficient
Check back regularly to stay up to date with everything new in Cased!
# Best Practices
> Interacting with Cased is designed to be as simple as talking to a colleague. There's no need to learn a special query language or to write complex prompts.
Interacting with Cased is designed to be as simple as talking to a colleague. There's no need to learn a special query language or to write complex prompts.
While pre-configured [Agents](/agents/overview) run automatically, you can also start chat sessions yourself to work interactively on infrastructure tasks.
Chat is powerful for infrastructure automation. Following a few simple guidelines will help you get the most out of it.
### Start with a Clear Goal
[Section titled “Start with a Clear Goal”](#start-with-a-clear-goal)
Give a clear goal to accomplish. Chat sessions are most effective when there’s a well-defined task to work on.
### Avoid pleasantries
[Section titled “Avoid pleasantries”](#avoid-pleasantries)
You can skip please, thank you, and “can you…” in favor of clear, specific goals or actions to take.
* **Bad:** “Can we please generate terraform?”
* **Good:** “Generate the Terraform for a new S3 bucket in our staging environment”
### Use Natural Language
[Section titled “Use Natural Language”](#use-natural-language)
There’s no need to write code or use special syntax. Just describe what you want to do in plain English, as if you were talking to a member of your team.
### Provide Context
[Section titled “Provide Context”](#provide-context)
Cased is great at discovering context using its available tools, but if you have relevant information, include it in your request. For example, if you’re debugging an issue, provide the error message you’re seeing or a summary of what you’ve already tried.
### Iterate and Refine
[Section titled “Iterate and Refine”](#iterate-and-refine)
Chat is designed to be interactive. If the first result isn’t quite right, provide additional information or instructions to help refine the response. Think of it as a conversation where you’re working together to solve a problem.
### Keep it Simple
[Section titled “Keep it Simple”](#keep-it-simple)
While it can be tempting to write a long, detailed prompt that covers every possible edge case, it’s often more effective to start with a simple request and then provide additional information as needed. If you have a complex task to accomplish, try breaking it down into smaller, more manageable sub-tasks.
# Chat Overview
> Start interactive conversations with Cased's AI to solve infrastructure problems, debug issues, and automate tasks.
Start interactive conversations with Cased's AI to solve infrastructure problems, debug issues, and automate tasks.
Cased’s chat interface lets you have interactive conversations with AI to handle infrastructure tasks. Unlike pre-configured [Agents](/agents/overview) that run automatically, chat sessions let you work interactively to solve problems.
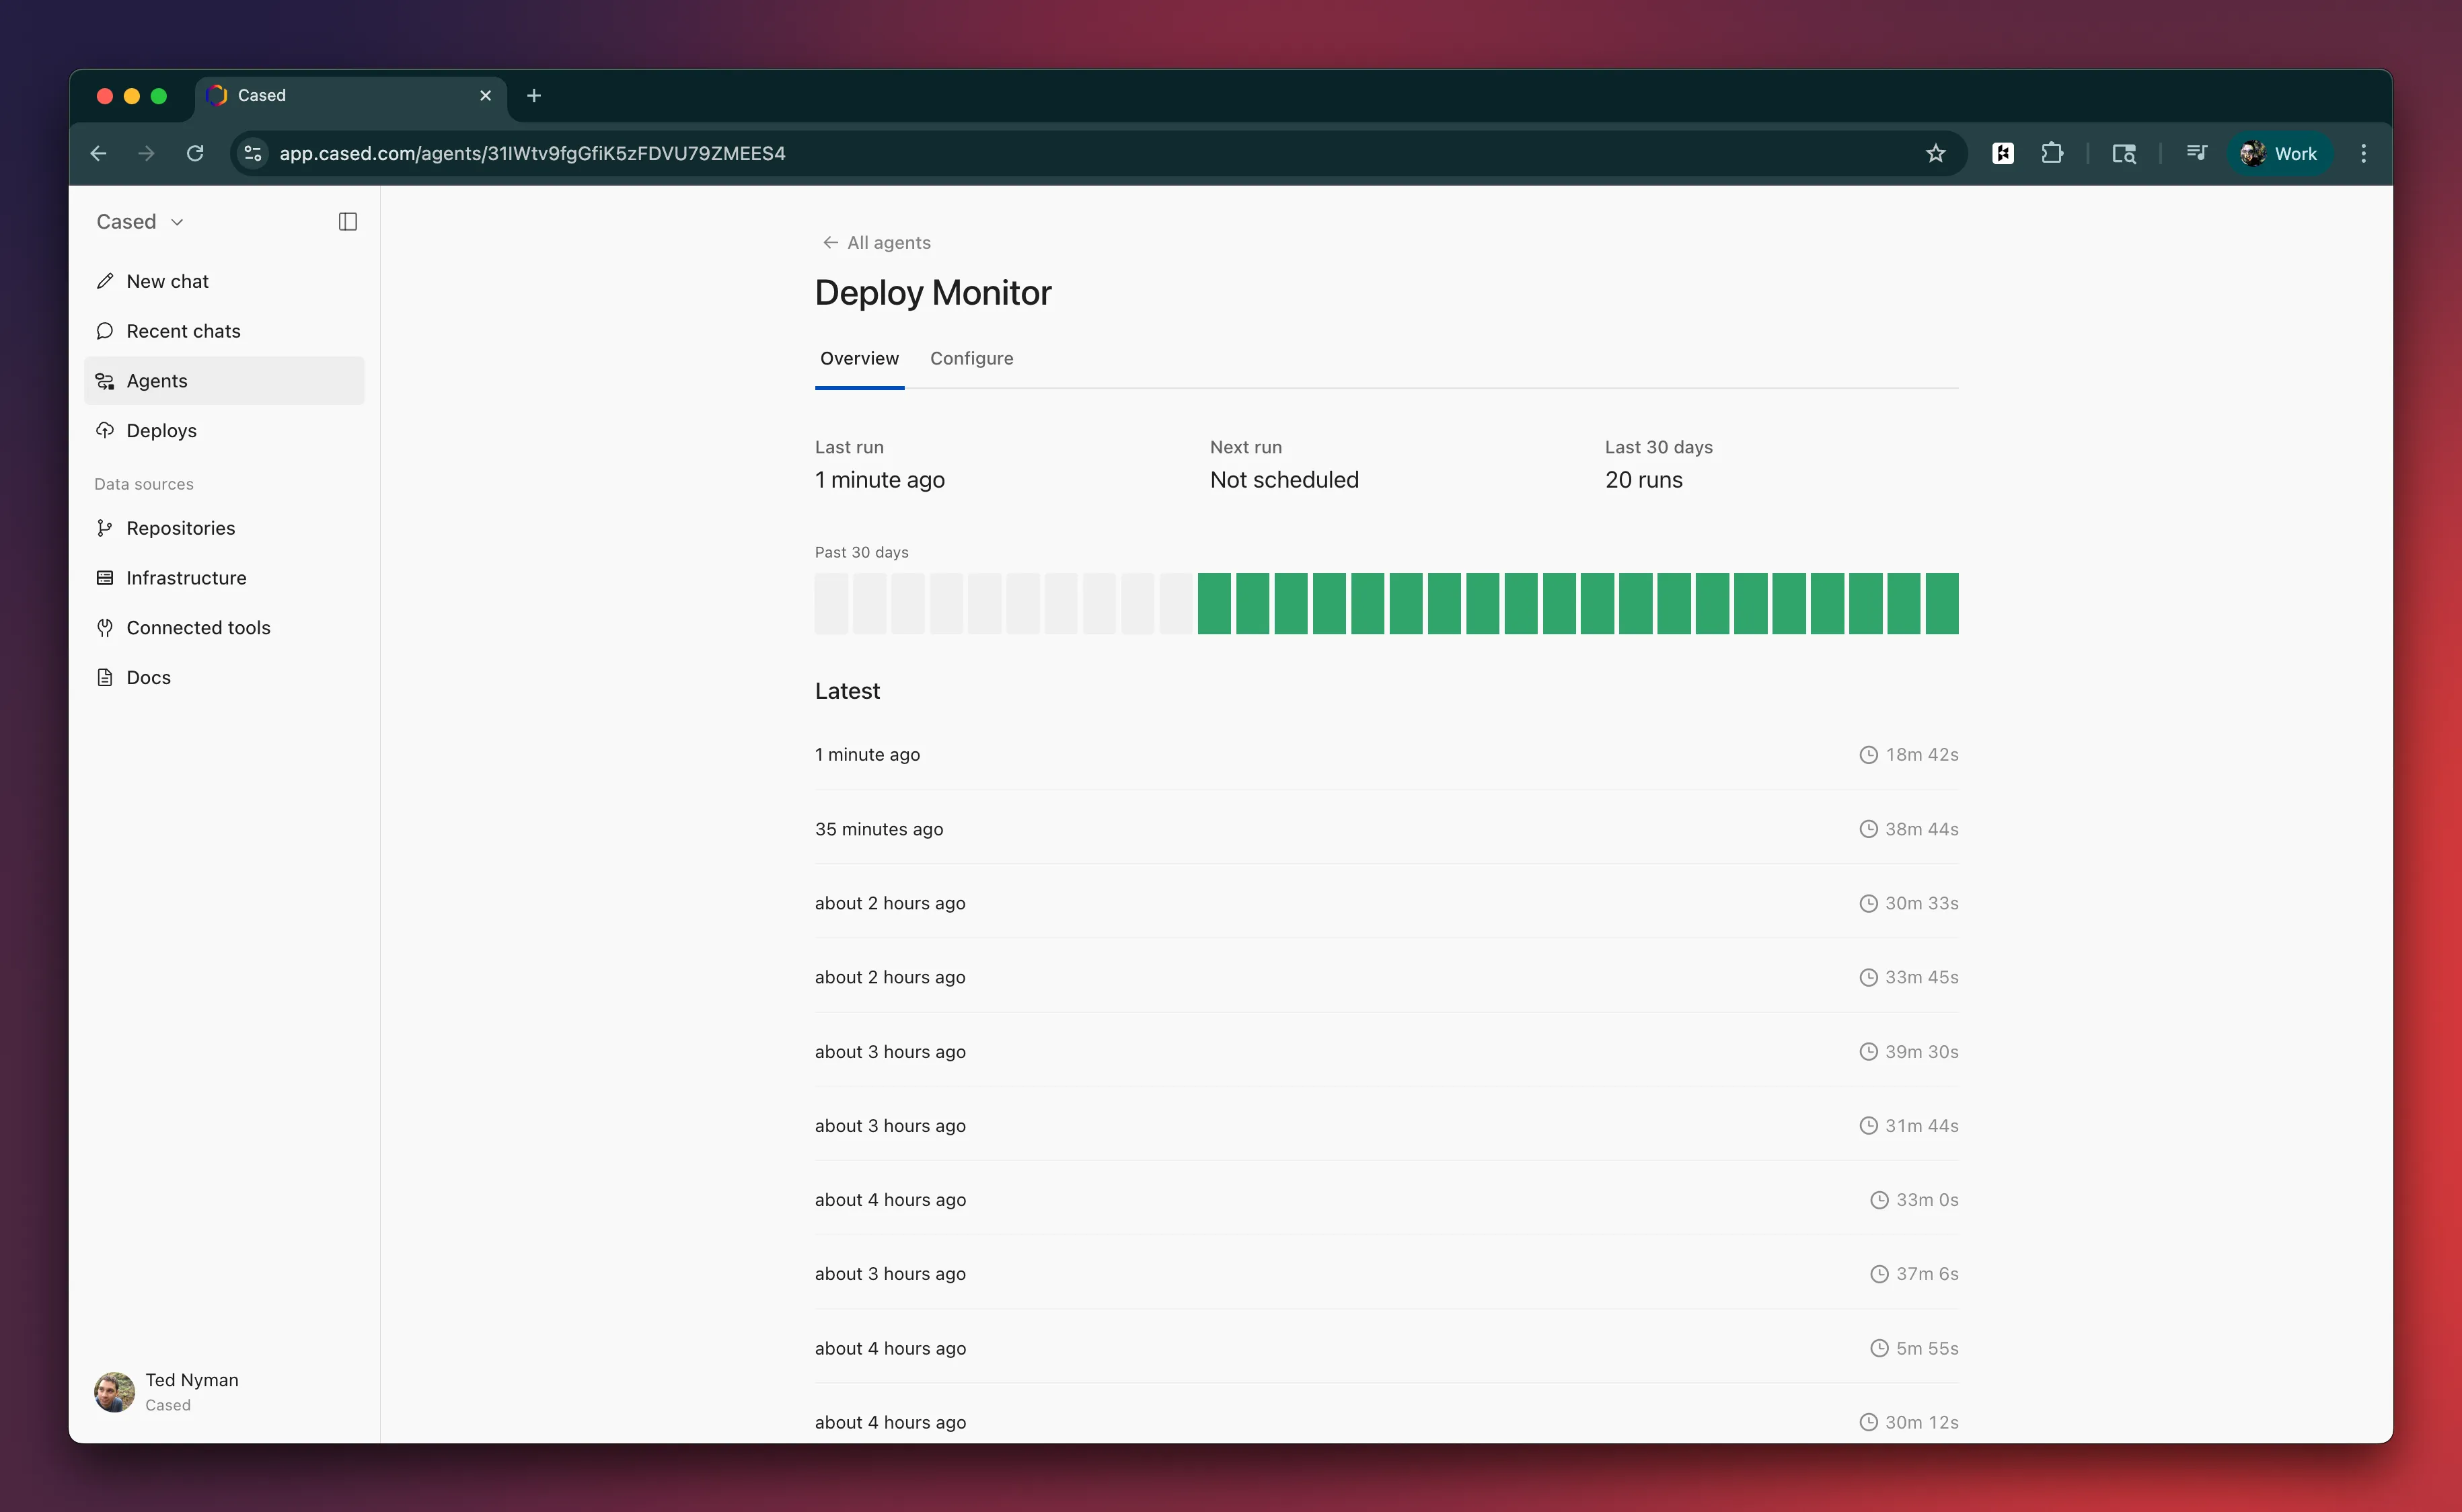
## How chat works
[Section titled “How chat works”](#how-chat-works)
When you start a new chat, you create a session where you can:
* Ask questions about your infrastructure
* Debug production issues
* Get help with Terraform or other IaC
* Create pull requests
* Manage cloud resources
The AI operates in a loop, using tools and integrations to gather information and take actions on your behalf.
### Tools
[Section titled “Tools”](#tools)
Cased comes with tools that are enabled by installing integrations.
These tools allow the AI to interact with other systems and perform actions on your behalf.
For example, by enabling the GitHub integration, it can create pull requests. With cloud provider integrations like AWS or GCP, it can manage your infrastructure.
### Sessions
[Section titled “Sessions”](#sessions)
Every chat creates a “session” that logs all activity.
This includes the conversation history, the tools that were used, and the status of the run. This allows you to see exactly what happened and debug any issues.
### Interactivity
[Section titled “Interactivity”](#interactivity)
Chat is designed to be interactive.
You can pause and resume, and you can provide additional information to help complete tasks. This allows you to work together to solve problems and automate complex operations.
## When to use chat vs agents
[Section titled “When to use chat vs agents”](#when-to-use-chat-vs-agents)
| Use chat when… | Use agents when… |
| ---------------------------------------- | -------------------------------------- |
| You need to debug an issue interactively | You have a repetitive task to automate |
| You want to explore your infrastructure | You want scheduled monitoring |
| You’re working on a one-off task | You want consistent, repeatable checks |
| You need to iterate on a solution | You want hands-off automation |
# Cased CLI
> Query telemetry, monitor LLM usage, and analyze performance from your terminal
Query telemetry, monitor LLM usage, and analyze performance from your terminal
The Cased CLI provides command-line access to your observability data. Query errors, traces, metrics, and LLM usage directly from your terminal.
## Installation
[Section titled “Installation”](#installation)
```bash
uv pip install cased-cli
```
## Configuration
[Section titled “Configuration”](#configuration)
### Web Authentication (Recommended)
[Section titled “Web Authentication (Recommended)”](#web-authentication-recommended)
The easiest way to authenticate is via your browser:
```bash
cased configure
```
This will:
1. Display a code like `ABC-123` and open your browser
2. Enter the code at the verification page while logged in
3. CLI automatically receives your token and saves it to `~/.config/cased/config.json`
Works in SSH sessions too—just copy the URL from the terminal and enter the code.
### Environment Variables
[Section titled “Environment Variables”](#environment-variables)
Alternatively, set your API key as an environment variable:
```bash
export CASED_API_KEY=your_api_key_here
```
Get your API key from [Settings](https://app.cased.com/settings).
Optionally set a custom API URL (defaults to `https://app.cased.com`):
```bash
export CASED_API_URL=https://app.cased.com
```
### Managing Authentication
[Section titled “Managing Authentication”](#managing-authentication)
```bash
# Check current auth status
cased configure
# Re-authenticate (get a new token)
cased configure --force
# Log out and remove saved credentials
cased logout
```
## Quick Start
[Section titled “Quick Start”](#quick-start)
```bash
# Follow logs in real-time
cased logs -f
# View recent errors
cased errors --since 1h
# Check trace performance
cased traces --service api --status error
# Monitor LLM costs
cased llm cost --since 24h
# Find slow spans
cased perf slow --threshold 500
# Get overall stats
cased stats
```
## Command Groups
[Section titled “Command Groups”](#command-groups)
| Command | Description |
| ------------------ | ---------------------------- |
| `cased logs` | Query application logs |
| `cased errors` | Query error events |
| `cased traces` | Query distributed traces |
| `cased metrics` | Query container metrics |
| `cased stats` | Overall telemetry statistics |
| `cased clusters` | List clusters with telemetry |
| `cased sessions` | List AI agent sessions |
| `cased session` | Get session details |
| `cased sourcemaps` | Manage source maps |
| `cased perf` | Performance analysis |
| `cased llm` | LLM monitoring |
## Global Options
[Section titled “Global Options”](#global-options)
All commands support:
| Option | Description |
| -------- | ------------------------------------------ |
| `--json` | Output as JSON instead of formatted tables |
| `--help` | Show help for a command |
***
## Application Logs
[Section titled “Application Logs”](#application-logs)
### `cased logs`
[Section titled “cased logs”](#cased-logs)
Query and tail application logs in real-time.
```bash
# Last 100 logs (default)
cased logs
# Last 50 logs
cased logs --tail 50
# Follow logs in real-time (like docker logs -f)
cased logs -f
# Follow with initial context
cased logs -f --tail 20
# Filter by level
cased logs -l error
cased logs -l warn
# Filter by service
cased logs -s api-server
# Search in messages
cased logs -q "timeout"
cased logs -q "connection refused" --since 1h
# Show full timestamps
cased logs -t
# Combine filters
cased logs -f -l error -s api-server
```
**Options:**
| Option | Default | Description |
| ------------------ | ------- | -------------------------------------------------------- |
| `--tail, -n` | 100 | Number of lines to show |
| `--follow, -f` | - | Follow logs in real-time |
| `--timestamps, -t` | - | Show full timestamps |
| `--since` | `1h` | Time range (1h, 24h, 7d) |
| `--level, -l` | - | Filter by level (trace, debug, info, warn, error, fatal) |
| `--service, -s` | - | Filter by service name |
| `--search, -q` | - | Search in log messages |
***
## Error Tracking
[Section titled “Error Tracking”](#error-tracking)
### `cased errors`
[Section titled “cased errors”](#cased-errors)
Query error events from your applications.
```bash
# Recent errors (last 24h)
cased errors
# Errors in the last hour
cased errors --since 1h
# Filter by severity
cased errors --level error
cased errors --level fatal
# Search in exception type/value
cased errors --search "KeyError"
cased errors --search "connection refused"
# Filter by project
cased errors --project my-project-id
# Output as JSON
cased errors --since 1h --json
```
**Options:**
| Option | Default | Description |
| ----------- | ------- | --------------------------------------- |
| `--since` | `24h` | Time range (1h, 24h, 7d) |
| `--level` | - | Filter by level (error, warning, fatal) |
| `--search` | - | Search in exception type/value |
| `--project` | - | Filter by project ID |
| `--limit` | 50 | Max results |
***
## Distributed Tracing
[Section titled “Distributed Tracing”](#distributed-tracing)
### `cased traces`
[Section titled “cased traces”](#cased-traces)
Query distributed traces and spans.
```bash
# Recent traces
cased traces --since 1h
# Filter by service
cased traces --service api
cased traces --service worker
# Filter by status
cased traces --status error
cased traces --status ok
# Get all spans for a specific trace
cased traces --trace-id abc123def456
# Filter by cluster
cased traces --cluster prod-us-east
```
**Options:**
| Option | Default | Description |
| ------------ | ------- | ---------------------------- |
| `--since` | `1h` | Time range |
| `--service` | - | Filter by service name |
| `--status` | - | Filter by status (ok, error) |
| `--trace-id` | - | Get all spans for a trace |
| `--cluster` | - | Filter by cluster ID |
| `--limit` | 50 | Max results |
***
## Metrics
[Section titled “Metrics”](#metrics)
### `cased metrics`
[Section titled “cased metrics”](#cased-metrics)
Query container metrics from your clusters.
```bash
# Recent metrics
cased metrics --since 1h
# Filter by pod
cased metrics --pod my-pod-abc123
# Filter by metric type
cased metrics --metric cpu_percent
cased metrics --metric memory_bytes
# Filter by namespace
cased metrics --namespace production
```
**Options:**
| Option | Default | Description |
| ------------- | ------- | --------------------- |
| `--since` | `1h` | Time range |
| `--cluster` | - | Filter by cluster ID |
| `--namespace` | - | Filter by namespace |
| `--pod` | - | Filter by pod name |
| `--metric` | - | Filter by metric name |
| `--limit` | 50 | Max results |
### `cased stats`
[Section titled “cased stats”](#cased-stats)
Get overall telemetry statistics.
```bash
cased stats
cased stats --json
```
### `cased clusters`
[Section titled “cased clusters”](#cased-clusters)
List clusters sending telemetry data.
```bash
cased clusters
cased clusters --json
```
***
## Agent Sessions
[Section titled “Agent Sessions”](#agent-sessions)
### `cased sessions`
[Section titled “cased sessions”](#cased-sessions)
List AI agent sessions.
```bash
# Recent sessions
cased sessions --since 24h
# Filter by status
cased sessions --status completed
cased sessions --status failed
cased sessions --status agent_running
# Filter by type
cased sessions --type root_cause_analysis
cased sessions --type deploy_monitor
```
**Options:**
| Option | Default | Description |
| ---------- | ------- | ---------------------- |
| `--since` | `24h` | Time range |
| `--status` | - | Filter by status |
| `--type` | - | Filter by session type |
| `--limit` | 20 | Max results |
### `cased session `
[Section titled “cased session \”](#cased-session-session_id)
Get details for a specific session.
```bash
# Basic details
cased session abc123
# Include execution logs
cased session abc123 --logs
# Include conversation history
cased session abc123 --conversation
# Full JSON output
cased session abc123 --json
```
***
## Source Maps
[Section titled “Source Maps”](#source-maps)
Manage source maps for JavaScript error de-minification.
### `cased sourcemaps upload`
[Section titled “cased sourcemaps upload”](#cased-sourcemaps-upload)
Upload source maps for a release.
```bash
# Upload source maps
cased sourcemaps upload -p my-app -r v1.2.3 dist/*.map
# With URL prefix
cased sourcemaps upload -p my-app -r v1.2.3 --url-prefix "~/" build/*.map
# Using git SHA as release
cased sourcemaps upload -p my-app -r $GIT_SHA dist/*.map
```
### `cased sourcemaps list`
[Section titled “cased sourcemaps list”](#cased-sourcemaps-list)
List uploaded source maps.
```bash
# All source maps for a project
cased sourcemaps list -p my-app
# Filter by release
cased sourcemaps list -p my-app -r v1.2.3
```
### `cased sourcemaps delete`
[Section titled “cased sourcemaps delete”](#cased-sourcemaps-delete)
Delete source maps for a release.
```bash
# Interactive confirmation
cased sourcemaps delete -p my-app -r v1.2.3
# Skip confirmation
cased sourcemaps delete -p my-app -r v1.2.3 -y
```
***
## Performance Analysis
[Section titled “Performance Analysis”](#performance-analysis)
Analyze trace performance, detect bottlenecks, and find regressions.
### `cased perf slow`
[Section titled “cased perf slow”](#cased-perf-slow)
Find spans exceeding a duration threshold.
```bash
# Find slow spans (>500ms default)
cased perf slow --since 1h
# Custom threshold (1 second)
cased perf slow --threshold 1000
# Filter by service
cased perf slow --service api --since 24h
```
**Options:**
| Option | Default | Description |
| ------------- | ------- | ---------------------- |
| `--since` | `1h` | Time range |
| `--threshold` | 500 | Minimum duration in ms |
| `--service` | - | Filter by service |
| `--limit` | 50 | Max results |
### `cased perf latency`
[Section titled “cased perf latency”](#cased-perf-latency)
View latency percentiles (p50, p95, p99).
```bash
# By service
cased perf latency --since 1h
# By endpoint
cased perf latency --service api --group-by endpoint
# Both service and endpoint
cased perf latency --group-by both
```
**Options:**
| Option | Default | Description |
| ------------ | --------- | --------------------------------- |
| `--since` | `1h` | Time range |
| `--service` | - | Filter by service |
| `--group-by` | `service` | Group by: service, endpoint, both |
### `cased perf n1`
[Section titled “cased perf n1”](#cased-perf-n1)
Detect N+1 query patterns.
```bash
# Find N+1 patterns
cased perf n1 --since 1h
# Require more repetitions
cased perf n1 --min-count 10
```
**Options:**
| Option | Default | Description |
| ------------- | ------- | --------------------------- |
| `--since` | `1h` | Time range |
| `--min-count` | 5 | Minimum repetitions to flag |
| `--limit` | 50 | Max results |
### `cased perf breakdown`
[Section titled “cased perf breakdown”](#cased-perf-breakdown)
Get service time breakdown for a trace.
```bash
cased perf breakdown
```
Shows where time was spent across different services in a trace.
### `cased perf regression`
[Section titled “cased perf regression”](#cased-perf-regression)
Detect performance regressions by comparing time periods.
```bash
# Compare last day to last week
cased perf regression --service api
# Custom periods
cased perf regression --service api --baseline 7d --compare 1d
# Filter by endpoint
cased perf regression --service api --endpoint /api/users
```
**Options:**
| Option | Default | Description |
| ------------ | ---------- | ------------------ |
| `--service` | (required) | Service to analyze |
| `--endpoint` | - | Filter by endpoint |
| `--baseline` | `7d` | Baseline period |
| `--compare` | `1d` | Comparison period |
### `cased perf summary`
[Section titled “cased perf summary”](#cased-perf-summary)
Get overall performance summary.
```bash
cased perf summary --since 1h
cased perf summary --since 24h
```
***
## LLM Monitoring
[Section titled “LLM Monitoring”](#llm-monitoring)
Track LLM usage, costs, latency, and errors.
### `cased llm usage`
[Section titled “cased llm usage”](#cased-llm-usage)
View token usage statistics.
```bash
# Usage by model
cased llm usage --since 24h
# Group by provider
cased llm usage --group-by provider
# Filter by model
cased llm usage --model gpt-4o
```
**Options:**
| Option | Default | Description |
| ------------ | ------- | ------------------------------- |
| `--since` | `24h` | Time range |
| `--model` | - | Filter by model |
| `--provider` | - | Filter by provider |
| `--group-by` | `model` | Group by: model, provider, both |
| `--limit` | 50 | Max results |
### `cased llm cost`
[Section titled “cased llm cost”](#cased-llm-cost)
View estimated LLM costs.
```bash
# Cost by model
cased llm cost --since 24h
# Filter by model
cased llm cost --model claude-sonnet-4
# Group by provider
cased llm cost --group-by provider
```
### `cased llm latency`
[Section titled “cased llm latency”](#cased-llm-latency)
View LLM latency percentiles.
```bash
cased llm latency --since 24h
cased llm latency --model gpt-4o
```
### `cased llm errors`
[Section titled “cased llm errors”](#cased-llm-errors)
View LLM error statistics.
```bash
# Error rates
cased llm errors --since 24h
# Filter by model
cased llm errors --model gpt-4o
```
### `cased llm summary`
[Section titled “cased llm summary”](#cased-llm-summary)
Get overall LLM usage summary.
```bash
cased llm summary --since 24h
cased llm summary --since 7d
```
Shows total calls, tokens, estimated costs, latency, and error rates.
### `cased llm sessions`
[Section titled “cased llm sessions”](#cased-llm-sessions)
View per-session LLM usage for multi-turn conversations.
```bash
# Sessions by cost (most expensive first)
cased llm sessions --sort-by cost
# Sessions by token usage
cased llm sessions --sort-by tokens
# Recent sessions
cased llm sessions --sort-by created --limit 10
```
**Options:**
| Option | Default | Description |
| ----------- | --------- | ------------------------------------- |
| `--since` | `24h` | Time range |
| `--sort-by` | `created` | Sort by: cost, calls, tokens, created |
| `--limit` | 20 | Max sessions |
***
## JSON Output
[Section titled “JSON Output”](#json-output)
All commands support `--json` for machine-readable output:
```bash
# Pipe to jq for filtering
cased errors --since 1h --json | jq '.events[] | select(.level == "fatal")'
# Save to file
cased llm cost --since 7d --json > weekly-costs.json
# Use in scripts
COST=$(cased llm summary --json | jq -r '.estimated_cost_usd')
echo "Weekly LLM cost: \$${COST}"
```
## Time Ranges
[Section titled “Time Ranges”](#time-ranges)
All `--since` options accept:
| Format | Example | Description |
| ------ | ----------------- | ------------ |
| Hours | `1h`, `6h`, `24h` | Last N hours |
| Days | `1d`, `7d`, `30d` | Last N days |
## Exit Codes
[Section titled “Exit Codes”](#exit-codes)
| Code | Description |
| ---- | -------------------------------------------------- |
| 0 | Success |
| 1 | Error (API error, connection error, invalid input) |
# Rules
> Define and enforce your organization's infrastructure, security, and compliance standards
Define and enforce your organization's infrastructure, security, and compliance standards
## Overview
[Section titled “Overview”](#overview)
Custom rules allow you to document your organization’s infrastructure, security, and compliance standards. These standards serve as guidelines for Cased’s built-in checks, helping ensure your infrastructure aligns with both industry best practices and your organization’s specific requirements.
Note that these rules don’t implement custom checks themselves, but rather define the standards and guidelines that Cased should enforce. Think of them as your organization’s infrastructure rulebook that Cased consults when performing its automated analysis.
## Creating Custom Rules
[Section titled “Creating Custom Rules”](#creating-custom-rules)
Rules are plain text files and stored in your repository as `.cased/rules`.
### Example Rules
[Section titled “Example Rules”](#example-rules)
Here’s an example of a `.cased/rules` file that defines your organization’s infrastructure standards:
```plaintext
# Infrastructure Standards
1. All resources must be tagged with:
- Environment (dev/staging/prod)
- Team owner
- Cost center
- Project name
2. Network Security
- VPCs must use private subnets for all application resources
- No public-facing resources except through load balancers
- All security groups must have explicit ingress/egress rules
- No 0.0.0.0/0 inbound access except for load balancers on ports 80/443
3. Resource Naming
- Use underscores instead of dashes
- Include environment prefix: {env}_{resource}_{purpose}
- Example: prod_rds_userdb, dev_ec2_worker
4. State Management
- Use remote state in S3 with state locking
- One state file per environment
- State files must be encrypted at rest
5. Module Usage
- Use company-approved modules from internal registry
- Pin module versions using git tags
- Document all module inputs in variables.tf
- Keep module nesting to maximum 2 levels
6. Cost Optimization
- Use spot instances for non-production workloads
- Enable auto-scaling for all production services
- Configure instance scheduling for dev environments
- Use appropriate instance sizes based on metrics
7. Monitoring
- Enable CloudWatch detailed monitoring
- Set up log retention policies
- Configure appropriate alarms for:
* CPU/Memory utilization
* Error rates
* Response times
* Cost thresholds
8. Backup and Recovery
- Enable automated backups for all databases
- Configure cross-region replication for critical data
- Test restore procedures quarterly
- Maintain point-in-time recovery capability
9. Security Compliance
- Enable encryption at rest for all data stores
- Use KMS for key management
- Rotate access keys every 90 days
- Enable MFA for all IAM users
```
## Rule Enforcement
[Section titled “Rule Enforcement”](#rule-enforcement)
Cased automatically enforces these rules during:
* Pull request reviews
* Infrastructure changes
* Compliance audits
## Best Practices for Writing Rules
[Section titled “Best Practices for Writing Rules”](#best-practices-for-writing-rules)
1. **Clarity**
* Write clear, specific descriptions
* Include both good and bad examples
* Document the rationale behind each rule
2. **Maintainability**
* Group related rules together
* Version control your rules
* Review and update rules regularly
# ArgoCD Integration
> Monitor and manage Kubernetes deployments from ArgoCD in Cased
Monitor and manage Kubernetes deployments from ArgoCD in Cased
# ArgoCD Integration Guide
[Section titled “ArgoCD Integration Guide”](#argocd-integration-guide)
Cased can receive deployment events from ArgoCD to monitor your Kubernetes deployments automatically. This guide will help you set up the integration.
## Quick Start (2 minutes)
[Section titled “Quick Start (2 minutes)”](#quick-start-2-minutes)
### Step 1: Get Your Setup Configuration
[Section titled “Step 1: Get Your Setup Configuration”](#step-1-get-your-setup-configuration)
```bash
# Get your personalized ArgoCD configuration
curl -H "Authorization: Bearer YOUR_API_KEY" https://app.cased.com/api/v1/argocd/setup
```
This returns a complete YAML configuration customized for your organization.
### Step 2: Apply the Configuration
[Section titled “Step 2: Apply the Configuration”](#step-2-apply-the-configuration)
Save the configuration to a file and apply it:
```bash
kubectl apply -f argocd-comet-notifications.yaml -n argocd
```
Or use our one-liner setup script:
```bash
curl -H "Authorization: Bearer YOUR_API_KEY" https://app.cased.com/api/v1/argocd/setup | \
jq -r '.setup_script' | bash
```
### Step 3: Annotate Your Applications
[Section titled “Step 3: Annotate Your Applications”](#step-3-annotate-your-applications)
Add these annotations to your ArgoCD Applications:
```yaml
apiVersion: argoproj.io/v1alpha1
kind: Application
metadata:
name: your-app
namespace: argocd
annotations:
# Subscribe to Cased notifications
notifications.argoproj.io/subscribe.on-sync-running.cased: ""
notifications.argoproj.io/subscribe.on-sync-succeeded.cased: ""
notifications.argoproj.io/subscribe.on-sync-failed.cased: ""
# Tell Cased which repository this belongs to
cased.com/repository: "owner/repo"
```
That’s it! ArgoCD will now send deployment events to Cased.
## What Gets Tracked
[Section titled “What Gets Tracked”](#what-gets-tracked)
Cased automatically captures:
* **Application sync status** (Syncing, Synced, OutOfSync, Failed)
* **Health status** (Healthy, Degraded, Progressing, Suspended)
* **Deployment metadata** (cluster, namespace, revision)
* **Timing information** (start time, end time, duration)
* **Error messages** when syncs fail
* **Resource counts** (number of resources synced)
## How It Works
[Section titled “How It Works”](#how-it-works)
1. ArgoCD triggers notifications when applications change state
2. Notifications are sent to Cased’s webhook endpoint
3. Cased creates deployment events and triggers monitoring workflows
4. Your team gets notified via Slack/email about deployment status
5. AI agents can respond to issues automatically
## Manual Configuration (Advanced)
[Section titled “Manual Configuration (Advanced)”](#manual-configuration-advanced)
If you prefer to configure manually, create this ConfigMap:
```yaml
apiVersion: v1
kind: ConfigMap
metadata:
name: argocd-notifications-cm
namespace: argocd
data:
# Webhook service for Cased
service.webhook.cased: |
url: https://app.cased.com/api/v1/argocd/webhook
headers:
- name: Authorization
value: Bearer YOUR_API_KEY
# Template that sends the full ArgoCD app state
template.cased-sync: |
webhook:
cased:
method: POST
body: |
{{ .ToJSON }}
# Triggers for different events
trigger.on-sync-running: |
- when: app.status.operationState.phase in ['Running']
send: [cased-sync]
trigger.on-sync-succeeded: |
- when: app.status.operationState.phase in ['Succeeded']
send: [cased-sync]
trigger.on-sync-failed: |
- when: app.status.operationState.phase in ['Failed', 'Error']
send: [cased-sync]
trigger.on-health-degraded: |
- when: app.status.health.status == 'Degraded'
send: [cased-sync]
```
## Testing the Integration
[Section titled “Testing the Integration”](#testing-the-integration)
### Test Webhook Connectivity
[Section titled “Test Webhook Connectivity”](#test-webhook-connectivity)
```bash
curl -X POST https://app.cased.com/api/v1/argocd/webhook \
-H "Authorization: Bearer YOUR_API_KEY" \
-H "Content-Type: application/json" \
-d '{
"app": {
"metadata": {
"name": "test-app",
"namespace": "argocd",
"annotations": {
"cased.com/repository": "owner/repo"
}
},
"status": {
"operationState": {
"phase": "Running"
}
}
}
}'
```
### Verify in Cased
[Section titled “Verify in Cased”](#verify-in-cased)
1. Go to your Cased dashboard
2. Navigate to Deployments
3. You should see ArgoCD deployments with the “ArgoCD” trigger type
## Troubleshooting
[Section titled “Troubleshooting”](#troubleshooting)
### Events Not Appearing
[Section titled “Events Not Appearing”](#events-not-appearing)
1. Check ArgoCD notifications controller logs:
```bash
kubectl logs -n argocd deployment/argocd-notifications-controller
```
2. Verify the ConfigMap is loaded:
```bash
kubectl get cm argocd-notifications-cm -n argocd -o yaml
```
3. Ensure your application has the correct annotations:
```bash
kubectl get application YOUR_APP -n argocd -o yaml | grep notifications
```
### Repository Not Found
[Section titled “Repository Not Found”](#repository-not-found)
If you see “repository not found” errors, ensure:
1. The repository exists in Cased
2. The `cased.com/repository` annotation matches exactly
3. Format is `owner/repo` (e.g., `myorg/myapp`)
### Testing Notifications
[Section titled “Testing Notifications”](#testing-notifications)
You can manually trigger a test notification:
```bash
kubectl exec -it deployment/argocd-notifications-controller -n argocd -- \
argocd-notifications template notify cased-sync YOUR_APP \
--recipient webhook:cased
```
## Security Considerations
[Section titled “Security Considerations”](#security-considerations)
* **API Key**: Store your API key securely. Consider using Kubernetes secrets
* **Network**: Ensure your ArgoCD cluster can reach api.cased.com
* **Permissions**: The API key only needs deployment event creation permissions
## Advanced Use Cases
[Section titled “Advanced Use Cases”](#advanced-use-cases)
### Multi-Cluster Deployments
[Section titled “Multi-Cluster Deployments”](#multi-cluster-deployments)
For multiple clusters, you can add cluster information to the annotations:
```yaml
annotations:
cased.com/repository: "owner/repo"
cased.com/cluster: "production-us-east"
cased.com/environment: "production"
```
### Custom Metadata
[Section titled “Custom Metadata”](#custom-metadata)
Add any custom metadata you want tracked:
```yaml
annotations:
cased.com/repository: "owner/repo"
cased.com/team: "platform"
cased.com/cost-center: "engineering"
```
### Selective Event Filtering
[Section titled “Selective Event Filtering”](#selective-event-filtering)
Only subscribe to specific events:
```yaml
annotations:
# Only notify on failures
notifications.argoproj.io/subscribe.on-sync-failed.cased: ""
notifications.argoproj.io/subscribe.on-health-degraded.cased: ""
```
## Integration with Cased Features
[Section titled “Integration with Cased Features”](#integration-with-cased-features)
Once integrated, you can:
* **Monitor deployments** across all your ArgoCD applications
* **Get alerts** when deployments fail or apps become unhealthy
* **Trigger runbooks** automatically on deployment issues
* **Ask the AI agent** about deployment history and patterns
* **Correlate** ArgoCD deployments with GitHub commits and CI builds
## Support
[Section titled “Support”](#support)
Need help? Contact us at or open an issue on GitHub.
# AWS
> Connect Cased to AWS to manage and monitor your cloud infrastructure
Connect Cased to AWS to manage and monitor your cloud infrastructure
## Quick Connect (Recommended)
[Section titled “Quick Connect (Recommended)”](#quick-connect-recommended)
The fastest way to set up AWS access for Cased is using our CloudFormation template:
1. **Go to Cased** - Navigate to
2. **Click Quick Connect AWS** - This will launch the AWS Console with the template pre-filled
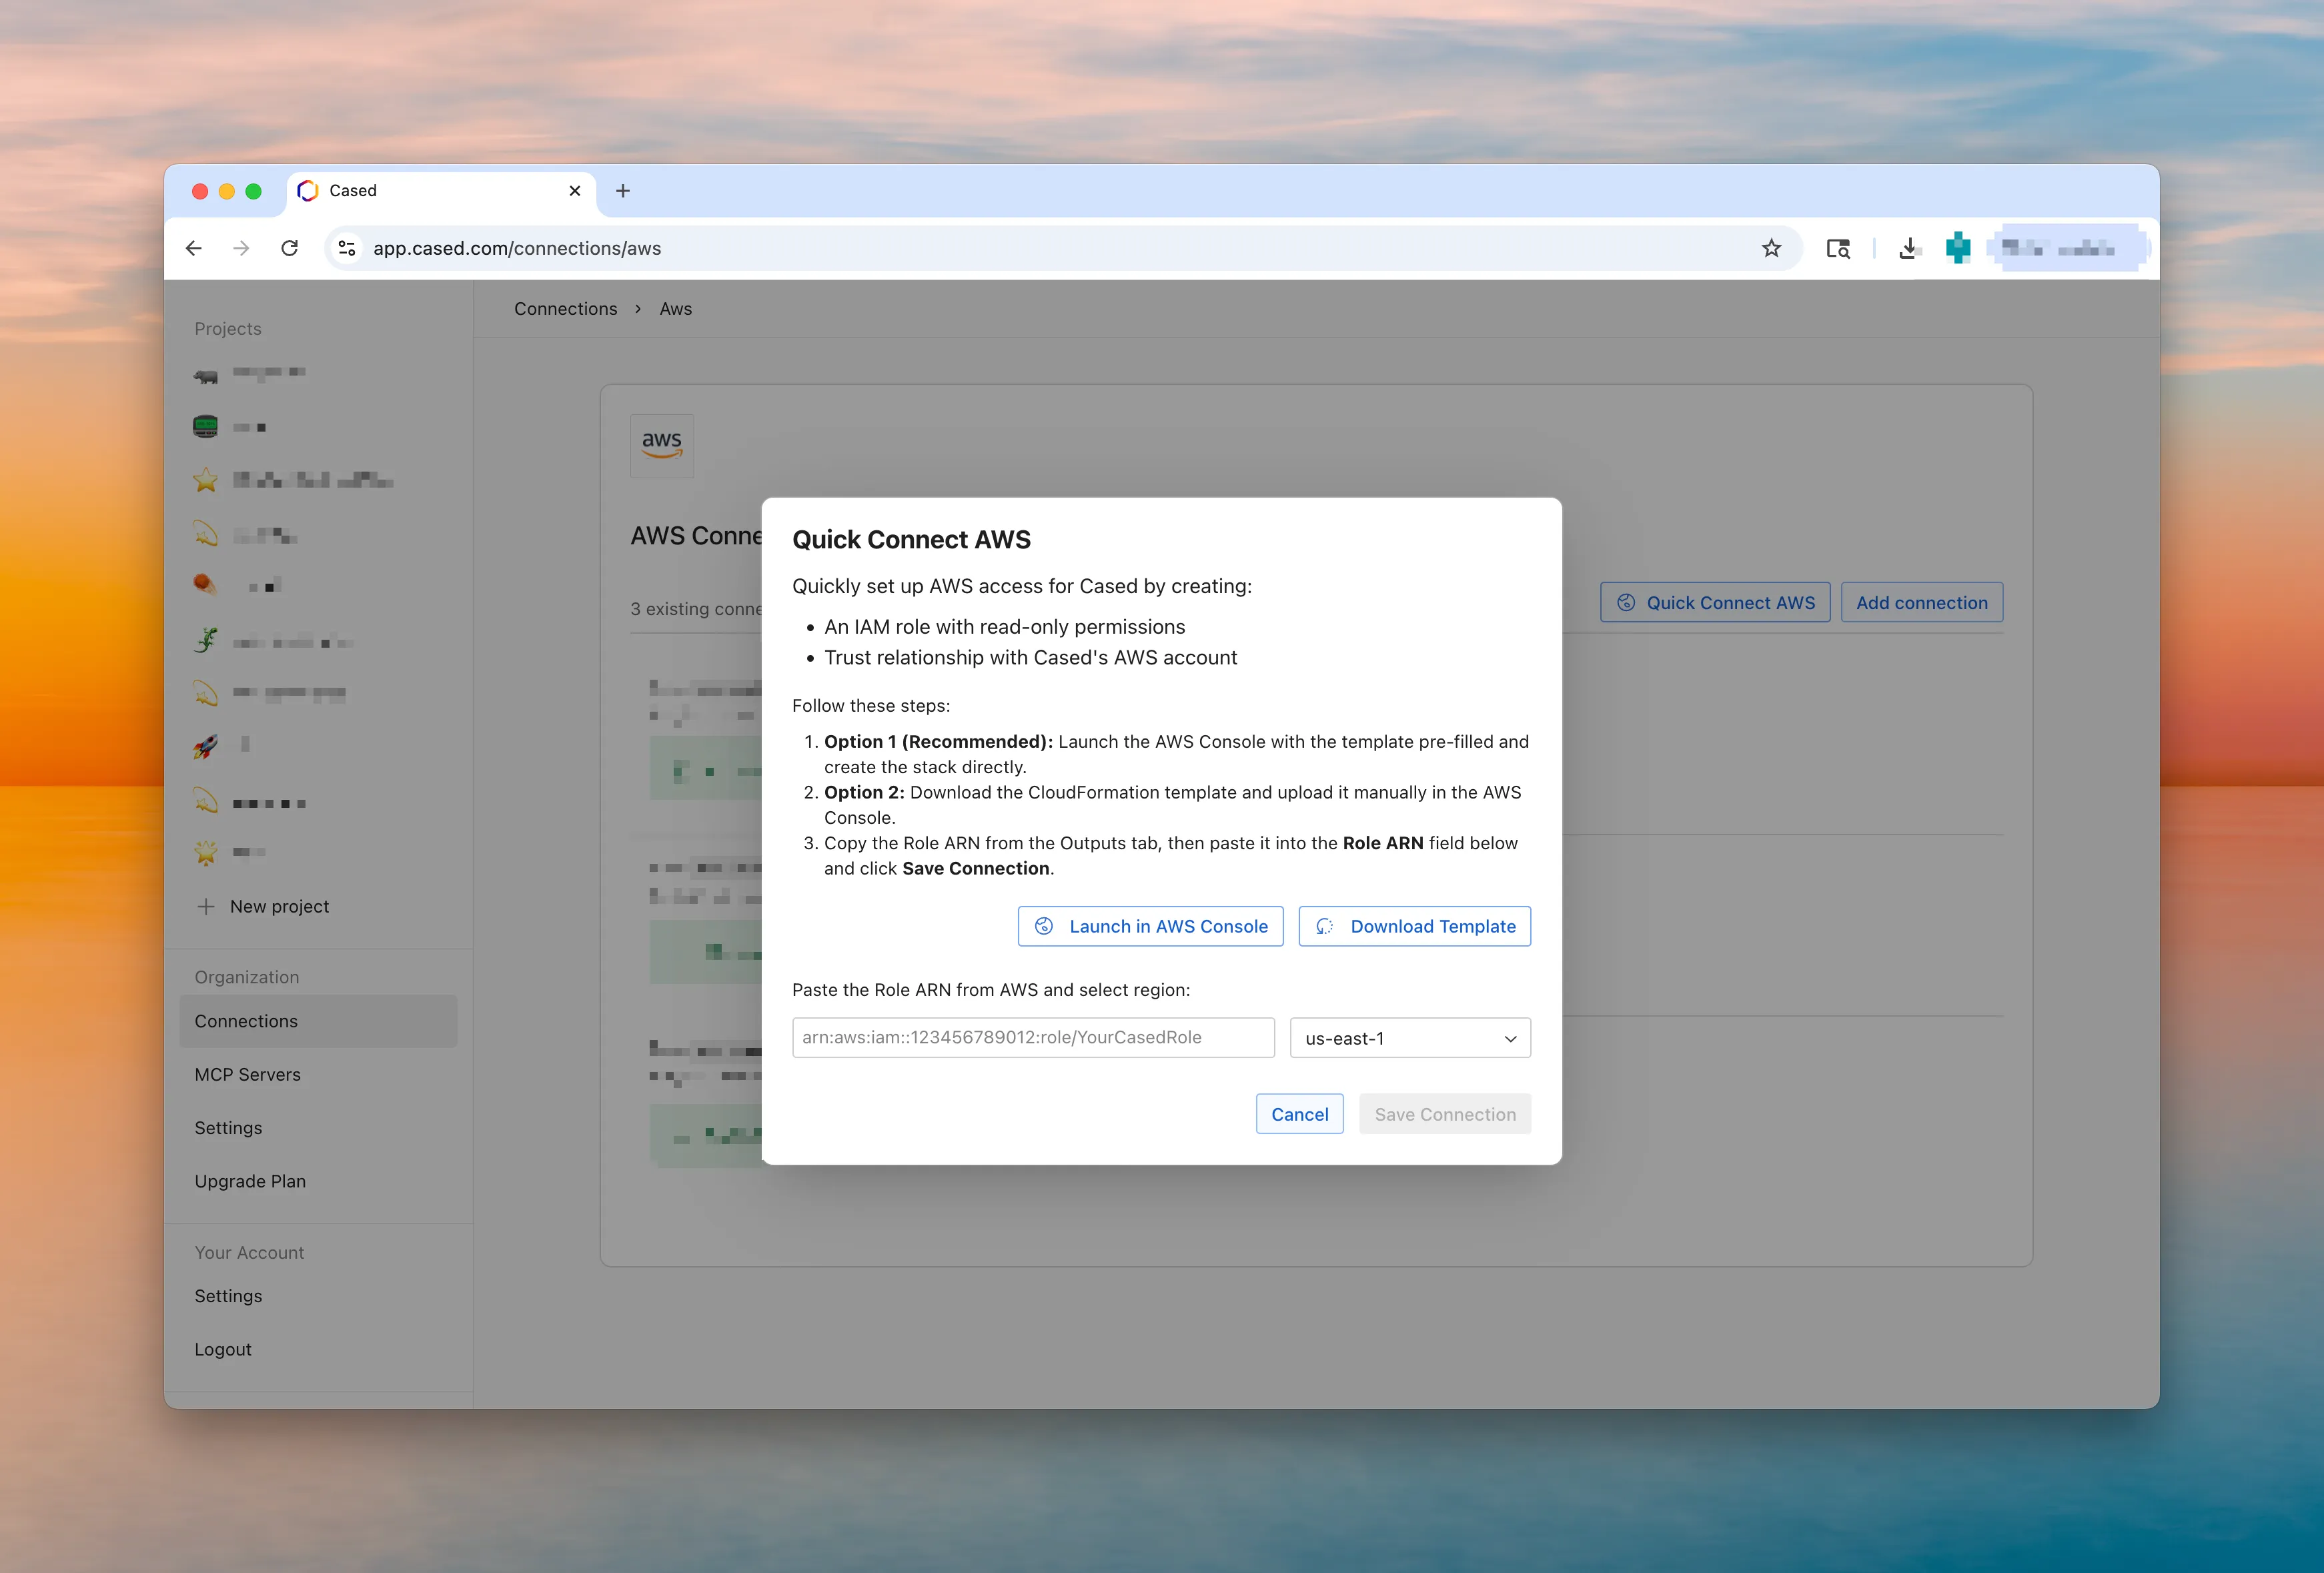
3. **Create the stack** - Follow the CloudFormation wizard to create the stack
4. **Get the Role ARN** - Copy the Role ARN from the Outputs tab after stack creation
5. **Configure Cased** - Paste the Role ARN and select your region in Cased’s connection settings
CloudFormation Template
```yaml
AWSTemplateFormatVersion: "2010-09-09"
Description: "Cased Quick Connect - Creates IAM Role for AWS Infrastructure Scanning"
Parameters:
RoleName:
Type: String
Default: CasedRole
Description: Name of the IAM role that will be created
Resources:
CasedInfraPolicy:
Type: AWS::IAM::ManagedPolicy
Properties:
Description: Policy for Cased to scan AWS infrastructure
PolicyDocument:
Version: "2012-10-17"
Statement:
- Sid: VisualEditor0
Effect: Allow
Action:
- autoscaling:Describe*
- cloudformation:Describe*
- cloudformation:ListStacks
- cloudfront:ListDistributions
- cloudtrail:DescribeTrails
- cloudtrail:GetTrail
- cloudtrail:GetTrailStatus
- cloudtrail:LookupEvents
- cloudwatch:DeleteAlarms
- cloudwatch:DescribeAlarmHistory
- cloudwatch:DescribeAlarms
- cloudwatch:DescribeAlarmsForMetric
- cloudwatch:GetMetricData
- cloudwatch:GetMetricStatistics
- cloudwatch:GetMetricWidgetImage
- cloudwatch:ListMetrics
- cloudwatch:ListTagsForResource
- cloudwatch:PutMetricAlarm
- cloudwatch:TagResource
- cloudwatch:UntagResource
- dynamodb:DescribeTable
- dynamodb:ListTables
- ec2:DescribeInstances
- ec2:DescribeNetworkInterfaces
- ec2:DescribeSecurityGroups
- ec2:DescribeSubnets
- ec2:DescribeVpcs
- ecs:DescribeClusters
- ecs:DescribeServices
- ecs:DescribeTaskDefinition
- ecs:DescribeTasks
- ecs:ListClusters
- ecs:ListServices
- ecs:ListTasks
- ecr:DescribeRepositories
- ecr:GetLifecyclePolicy
- ecr:GetRegistryScanningConfiguration
- ecr:GetRepositoryPolicy
- ecr:ListImages
- ecr:ListTagsForResource
- eks:ListClusters
- eks:DescribeCluster
- eks:ListNodegroups
- elasticache:Describe*
- elasticache:ListTagsForResource
- elasticbeanstalk:DescribeEnvironments
- elasticloadbalancing:DescribeLoadBalancers
- iam:GetPolicy
- iam:GetPolicyVersion
- iam:GetRole
- iam:ListAttachedRolePolicies
- iam:ListPolicies
- iam:ListRoles
- iam:ListUsers
- kms:DescribeKey
- kms:ListKeys
- lambda:ListFunctions
- logs:DescribeLogStreams
- logs:DescribeLogGroups
- logs:GetLogEvents
- logs:FilterLogEvents
- rds:DescribeDBInstances
- rds:DescribeDBSnapshots
- rds:DescribeEvents
- rds:ListTagsForResource
- s3:GetBucketLifecycleConfiguration
- s3:GetBucketLocation
- s3:GetBucketPublicAccessBlock
- s3:GetBucketTagging
- s3:GetBucketVersioning
- s3:GetEncryptionConfiguration
- s3:GetObject
- s3:ListAllMyBuckets
- s3:ListBucket
- sns:CreateTopic
- sns:GetTopicAttributes
- sns:ListSubscriptions
- sns:ListTopics
- sns:Subscribe
- sqs:ListQueues
Resource: "*"
CasedInfraRole:
Type: AWS::IAM::Role
Properties:
RoleName: !Ref RoleName
Description: IAM role for Cased to work with AWS infrastructure
AssumeRolePolicyDocument:
Version: "2012-10-17"
Statement:
- Effect: Allow
Principal:
AWS: "arn:aws:iam::495860673956:root"
Action: "sts:AssumeRole"
ManagedPolicyArns:
- !Ref CasedInfraPolicy
Outputs:
RoleARN:
Description: ARN of the created IAM role. Copy this value into Cased.
Value: !GetAtt CasedInfraRole.Arn
```
## Pulumi Setup
[Section titled “Pulumi Setup”](#pulumi-setup)
If you’re using Pulumi for infrastructure management, you can create the IAM role with this TypeScript code:
Pulumi TypeScript Example
```typescript
import * as pulumi from "@pulumi/pulumi";
import * as aws from "@pulumi/aws";
// Configuration
const config = new pulumi.Config();
const roleName = config.get("roleName") || "CasedRole";
// Create the policy document for Cased infrastructure scanning
const casedInfraPolicyDocument = aws.iam.getPolicyDocument({
statements: [
{
sid: "VisualEditor0",
effect: "Allow",
actions: [
"autoscaling:Describe*",
"cloudformation:Describe*",
"cloudformation:ListStacks",
"cloudfront:ListDistributions",
"cloudtrail:DescribeTrails",
"cloudtrail:GetTrail",
"cloudtrail:GetTrailStatus",
"cloudtrail:LookupEvents",
"cloudwatch:DeleteAlarms",
"cloudwatch:DescribeAlarmHistory",
"cloudwatch:DescribeAlarms",
"cloudwatch:DescribeAlarmsForMetric",
"cloudwatch:GetMetricData",
"cloudwatch:GetMetricStatistics",
"cloudwatch:GetMetricWidgetImage",
"cloudwatch:ListMetrics",
"cloudwatch:ListTagsForResource",
"cloudwatch:PutMetricAlarm",
"cloudwatch:TagResource",
"cloudwatch:UntagResource",
"dynamodb:DescribeTable",
"dynamodb:ListTables",
"ec2:DescribeInstances",
"ec2:DescribeNetworkInterfaces",
"ec2:DescribeSecurityGroups",
"ec2:DescribeSubnets",
"ec2:DescribeVpcs",
"ecs:DescribeClusters",
"ecs:DescribeServices",
"ecs:DescribeTaskDefinition",
"ecs:DescribeTasks",
"ecs:ListClusters",
"ecs:ListServices",
"ecs:ListTasks",
"ecr:DescribeRepositories",
"ecr:GetLifecyclePolicy",
"ecr:GetRegistryScanningConfiguration",
"ecr:GetRepositoryPolicy",
"ecr:ListImages",
"ecr:ListTagsForResource",
"eks:ListClusters",
"eks:DescribeCluster",
"eks:ListNodegroups",
"elasticache:Describe*",
"elasticache:ListTagsForResource",
"elasticbeanstalk:DescribeEnvironments",
"elasticloadbalancing:DescribeLoadBalancers",
"iam:GetPolicy",
"iam:GetPolicyVersion",
"iam:GetRole",
"iam:ListAttachedRolePolicies",
"iam:ListPolicies",
"iam:ListRoles",
"iam:ListUsers",
"kms:DescribeKey",
"kms:ListKeys",
"lambda:ListFunctions",
"logs:DescribeLogStreams",
"logs:DescribeLogGroups",
"logs:GetLogEvents",
"logs:FilterLogEvents",
"rds:DescribeDBInstances",
"rds:DescribeDBSnapshots",
"rds:DescribeEvents",
"rds:ListTagsForResource",
"s3:GetBucketLifecycleConfiguration",
"s3:GetBucketLocation",
"s3:GetBucketPublicAccessBlock",
"s3:GetBucketTagging",
"s3:GetBucketVersioning",
"s3:GetEncryptionConfiguration",
"s3:GetObject",
"s3:ListAllMyBuckets",
"s3:ListBucket",
"sns:CreateTopic",
"sns:GetTopicAttributes",
"sns:ListSubscriptions",
"sns:ListTopics",
"sns:Subscribe",
"sqs:ListQueues",
],
resources: ["*"],
},
],
});
// Create the managed policy for Cased infrastructure scanning
const casedInfraPolicy = new aws.iam.Policy("CasedInfraPolicy", {
description: "Policy for Cased to scan AWS infrastructure",
policy: casedInfraPolicyDocument.then((doc) => doc.json),
});
// Create the IAM role for Cased
const casedInfraRole = new aws.iam.Role("CasedInfraRole", {
name: roleName,
description: "IAM role for Cased to work with AWS infrastructure",
assumeRolePolicy: JSON.stringify({
Version: "2012-10-17",
Statement: [
{
Effect: "Allow",
Principal: {
AWS: "arn:aws:iam::495860673956:root",
},
Action: "sts:AssumeRole",
},
],
}),
managedPolicyArns: [casedInfraPolicy.arn],
});
export const roleArn = casedInfraRole.arn;
export const roleName_output = casedInfraRole.name;
export const policyArn = casedInfraPolicy.arn;
```
After running `pulumi up`, copy the `roleArn` output value and paste it into Cased’s AWS connection settings.
## Manual Setup
[Section titled “Manual Setup”](#manual-setup)
If you prefer to set up the IAM role manually:
1. In your AWS Management Console go to the IAM service
2. Create IAM Policy under Policies create a new policy in the JSON editor.
3. Paste this JSON into the policy editor and name is `CasedPolicy`.
CasedPolicy
```json
{
"Version": "2012-10-17",
"Statement": [
{
"Effect": "Allow",
"Action": [
"autoscaling:Describe*",
"cloudformation:Describe*",
"cloudformation:ListStacks",
"cloudfront:ListDistributions",
"cloudtrail:DescribeTrails",
"cloudtrail:GetTrail",
"cloudtrail:GetTrailStatus",
"cloudtrail:LookupEvents",
"cloudwatch:DeleteAlarms",
"cloudwatch:DescribeAlarmHistory",
"cloudwatch:DescribeAlarms",
"cloudwatch:DescribeAlarmsForMetric",
"cloudwatch:GetMetricData",
"cloudwatch:GetMetricStatistics",
"cloudwatch:GetMetricWidgetImage",
"cloudwatch:ListMetrics",
"cloudwatch:ListTagsForResource",
"cloudwatch:PutMetricAlarm",
"cloudwatch:TagResource",
"cloudwatch:UntagResource",
"dynamodb:DescribeTable",
"dynamodb:ListTables",
"ec2:DescribeInstances",
"ec2:DescribeNetworkInterfaces",
"ec2:DescribeSecurityGroups",
"ec2:DescribeSubnets",
"ec2:DescribeVpcs",
"ecs:DescribeClusters",
"ecs:DescribeServices",
"ecs:DescribeTaskDefinition",
"ecs:DescribeTasks",
"ecs:ListClusters",
"ecs:ListServices",
"ecs:ListTasks",
"ecr:DescribeRepositories",
"ecr:GetLifecyclePolicy",
"ecr:GetRegistryScanningConfiguration",
"ecr:GetRepositoryPolicy",
"ecr:ListImages",
"ecr:ListTagsForResource",
"eks:ListClusters",
"eks:DescribeCluster",
"eks:ListNodegroups",
"elasticache:Describe*",
"elasticache:ListTagsForResource",
"elasticbeanstalk:DescribeEnvironments",
"elasticloadbalancing:DescribeLoadBalancers",
"iam:GetPolicy",
"iam:GetPolicyVersion",
"iam:GetRole",
"iam:ListAttachedRolePolicies",
"iam:ListPolicies",
"iam:ListRoles",
"iam:ListUsers",
"kms:DescribeKey",
"kms:ListKeys",
"lambda:ListFunctions",
"logs:DescribeLogStreams",
"logs:DescribeLogGroups",
"logs:GetLogEvents",
"logs:FilterLogEvents",
"rds:DescribeDBInstances",
"rds:DescribeDBSnapshots",
"rds:DescribeEvents",
"rds:ListTagsForResource",
"s3:GetBucketLifecycleConfiguration",
"s3:GetBucketLocation",
"s3:GetBucketPublicAccessBlock",
"s3:GetBucketTagging",
"s3:GetBucketVersioning",
"s3:GetEncryptionConfiguration",
"s3:GetObject",
"s3:ListAllMyBuckets",
"s3:ListBucket",
"sns:CreateTopic",
"sns:GetTopicAttributes",
"sns:ListSubscriptions",
"sns:ListTopics",
"sns:Subscribe",
"sqs:ListQueues"
],
"Resource": "*"
}
]
}
```
Note
The policy grants primarily read-only access to common AWS services, with limited write permissions for CloudWatch alarm management. This allows Cased to:
* List and describe EC2 instances
* View CloudWatch metrics
* Access CloudTrail logs
* List resources in ECS, RDS, and other services
* Create and manage CloudWatch alarms for agent triggers (see [CloudWatch Triggers](#cloudwatch-triggers-beta) below)
4. Create IAM Role
* Open IAM in AWS Console
* Go to Roles → Create role
* Choose “AWS account” as trusted entity type
* Enter Cased account ID: `495860673956`
* Attach the policy you created
* Name the role (e.g., `CasedRole`)
5. Almost done! Configure Cased:
* Copy your Role ARN from the role summary page
* Format: `arn:aws:iam:::role/CasedRole`
* Paste the ARN in Cased’s AWS connection settings
* Select your AWS region
## CloudWatch Triggers (Beta)
[Section titled “CloudWatch Triggers (Beta)”](#cloudwatch-triggers-beta)
CloudWatch triggers allow agents to automatically execute when AWS CloudWatch alarms are triggered. This enables proactive incident response for infrastructure issues like high CPU usage, database connection limits, or application errors.
### How It Works
[Section titled “How It Works”](#how-it-works)
1. **Create or Adopt Alarms** - Use Cased’s agent to create new CloudWatch alarms or adopt existing ones
2. **SNS Topic** - Cased automatically creates an SNS topic in your AWS account for alarm notifications
3. **Webhook Integration** - The SNS topic subscribes to Cased’s webhook endpoint
4. **Agent Execution** - When an alarm enters the ALARM state, your agent runs automatically
### Required Permissions
[Section titled “Required Permissions”](#required-permissions)
The IAM policies above include the necessary permissions for CloudWatch triggers:
**CloudWatch Alarm Management:**
* `PutMetricAlarm` - Create/update alarms
* `DeleteAlarms` - Remove alarms
* `DescribeAlarms`, `DescribeAlarmsForMetric`, `DescribeAlarmHistory` - List and inspect alarms
* `TagResource`, `UntagResource`, `ListTagsForResource` - Tag alarms as Cased-managed
**SNS Topic Management:**
* `CreateTopic` - Create notification topic for your organization
* `Subscribe` - Subscribe Cased webhook to receive alarm notifications
* `GetTopicAttributes` - Check if topic exists
### Using CloudWatch Triggers
[Section titled “Using CloudWatch Triggers”](#using-cloudwatch-triggers)
Once your IAM role has the required permissions:
1. **In Agents** - Add a CloudWatch Alarm trigger when creating or editing an agent
2. **Via Chat** - Ask Cased to create alarms for specific metrics (e.g., “Create an alarm for RDS CPU usage above 80%”)
3. **Adopt Existing** - Connect existing CloudWatch alarms to Cased agents without modifying their settings
### Security Considerations
[Section titled “Security Considerations”](#security-considerations)
* **Alarm Ownership** - Cased only deletes/updates alarms it created (tracked via `ManagedBy: Cased` tag)
* **Organization Isolation** - SNS topics include your organization ID to prevent cross-org access
* **Webhook Authentication** - All webhook requests are cryptographically signed and validated
* **Least Privilege** - Alarm management permissions are scoped to specific operations only
### Feature Access
[Section titled “Feature Access”](#feature-access)
CloudWatch triggers are in beta. Contact Cased support to enable this feature for your organization.
# BetterStack
> Connect Cased to BetterStack to access and analyze your logs
Connect Cased to BetterStack to access and analyze your logs
# BetterStack
[Section titled “BetterStack”](#betterstack)
To connect to BetterStack, you need a Telemetry API token with access to logs.
## Obtain a Telemetry API Token
[Section titled “Obtain a Telemetry API Token”](#obtain-a-telemetry-api-token)
BetterStack offers different types of API tokens:
* Telemetry API tokens: For managing sources, dashboards, logs & metrics
* Uptime API tokens: For managing monitors, heartbeats, status pages, and incidents
* Global tokens: Access all teams and resources
* Team-based tokens: Access specific team resources only
For Cased integration, you need a Telemetry API token with access to logs:
1. Log in to your BetterStack account
2. Go to Settings > API Keys
3. Click “Create API Key”
4. Select “Telemetry API token”
5. Give your token a name (e.g., “Cased Integration”)
6. Ensure the token has access to the logs you want to monitor
7. Copy the generated API token immediately, as it will only be shown once
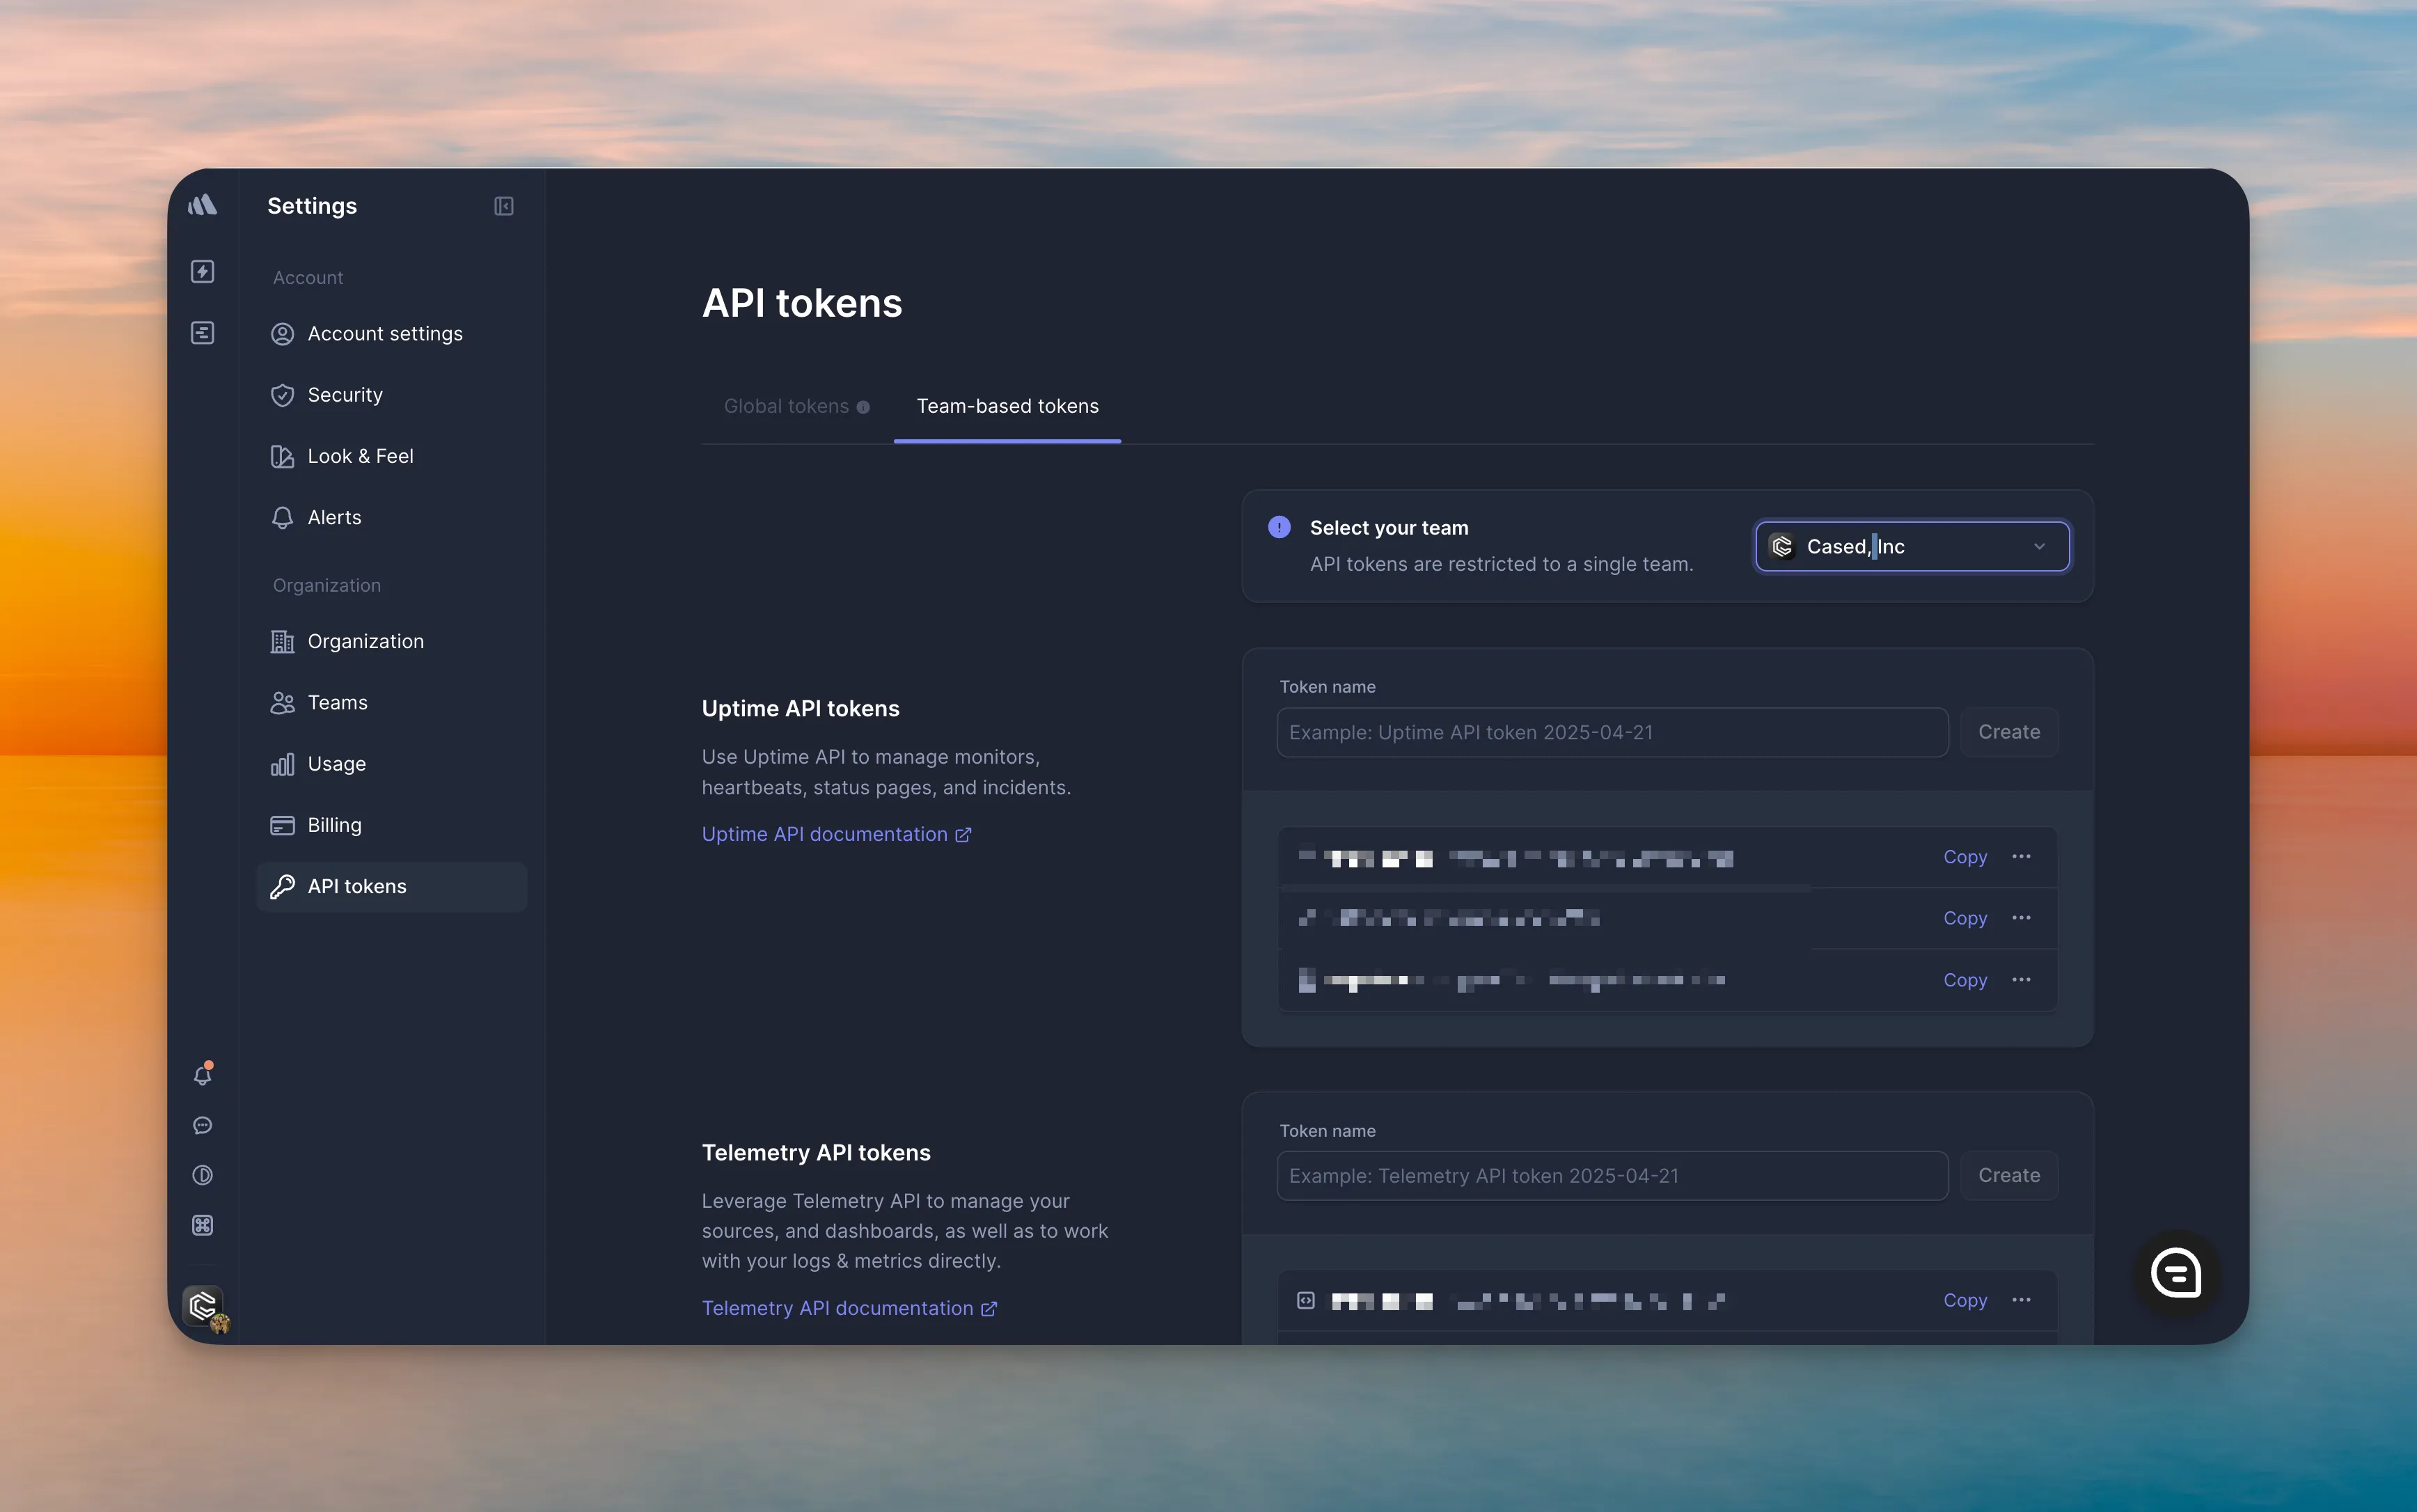
## Connect to Cased
[Section titled “Connect to Cased”](#connect-to-cased)
1. Go to [app.cased.com/connections/betterstack](https://app.cased.com/connections/betterstack)
2. Enter your BetterStack Telemetry API token
3. Cased agent can start using the BetterStack connection.
# Datadog
> Connect Cased to Datadog to monitor your deploys and infrastructure changes
Connect Cased to Datadog to monitor your deploys and infrastructure changes
# Datadog
[Section titled “Datadog”](#datadog)
To connect to Datadog, you will need to generate two keys:
* An API key
* An application key
## Generate an API key
[Section titled “Generate an API key”](#generate-an-api-key)
1. Navigate to the API Keys section under Integrations > APIs or visit [Datadog API Settings](https://app.datadoghq.com/account/settings)
2. Click the ‘Create API key’ button and give it a name, like `cased`
3. Enter the generated API key on Cased at [app.cased.com/connections/datadog](https://app.cased.com/connections/datadog)
### API Key Scopes
[Section titled “API Key Scopes”](#api-key-scopes)
You can setup scopes to limit the API key’s access to specific resources and abilities. Datadog’s scopes don’t grant new permissions, but rather restrict default ones. When a key is created it begins with all scopes unless you add scopes.
We recommend not scoping the metrics so Cased can do its best and get the most data for you.
## Generate an application key
[Section titled “Generate an application key”](#generate-an-application-key)
1. In the same API Keys section, scroll down to the Application Keys
2. Click the ‘Create Application Key’ button
3. Provide a name for the application key and select the desired user
4. Enter the generated Application key on Cased at [app.cased.com/connections/datadog](https://app.cased.com/connections/datadog)
# Fly.io
> Connect Cased to Fly.io to manage your deployments and infrastructure
Connect Cased to Fly.io to manage your deployments and infrastructure
# Fly.io
[Section titled “Fly.io”](#flyio)
To integrate our service with your Fly.io account, we need your Fly.io organization name and access token.
## Obtain Your Organization Name
[Section titled “Obtain Your Organization Name”](#obtain-your-organization-name)
1. Log in to your [Fly.io Dashboard](https://fly.io/dashboard)
2. Your organization name is displayed at the top of the dashboard
## Generate an Access Token
[Section titled “Generate an Access Token”](#generate-an-access-token)
1. Visit [Fly.io Dashboard Access Token](https://fly.io/user/personal_access_tokens)
2. On the right side of the page, find the **Create token** section
3. Name your token something descriptive, like “Cased”
4. Click on **Create**
5. You will be presented with a “Token generated” notification
6. Your token is only visible one time, ensure you copy it!
## Connect to Cased
[Section titled “Connect to Cased”](#connect-to-cased)
1. Go to [app.cased.com/connections/flyio](https://app.cased.com/connections/flyio)
2. Enter your Fly.io organization name
3. Paste the access token you copied in Step 6
4. Cased will start using the Fly.io connection.
# Google Cloud Platform
> Connect Cased to Google Cloud Platform to monitor your logs and infrastructure
Connect Cased to Google Cloud Platform to monitor your logs and infrastructure
# Google Cloud Platform
[Section titled “Google Cloud Platform”](#google-cloud-platform)
To integrate Cased with your Google Cloud Platform account, you’ll need to create a service account with the appropriate permissions.
## Create a Service Account
[Section titled “Create a Service Account”](#create-a-service-account)
1. Go to the [Google Cloud Console](https://console.cloud.google.com/) and sign in with your GCP account
2. Click on the menu icon on the top left corner of the console, then go to IAM & Admin > IAM
3. If you have multiple projects, select the project where you want to create the service account from the dropdown menu at the top of the page
4. Click on the **+ Add** button at the top of the IAM page
5. In the **New principals** section, click on **Service account**
6. Enter a name and optional description for the service account
7. In the **Role** dropdown menu, search for **Logs Viewer**
8. Select **Logs Viewer** from the list of roles
## Generate a Service Account Key
[Section titled “Generate a Service Account Key”](#generate-a-service-account-key)
1. After creating the service account and assigning the Logs Viewer role, click on “Create key” under the “Service account key” section
2. Choose the key type as JSON
3. Click on “Create” to generate and download the JSON key file
## Connect to Cased
[Section titled “Connect to Cased”](#connect-to-cased)
1. Go to [app.cased.com/connections/gcp](https://app.cased.com/connections/gcp)
2. Upload the JSON key file you downloaded
3. Cased agent will start using the GCP connection.
# GitHub
> Connect Cased to GitHub to manage your repositories and workflows
Connect Cased to GitHub to manage your repositories and workflows
# GitHub
[Section titled “GitHub”](#github)
Connect GitHub to Cased by adding the Cased Integration app.
## Install the Cased Integration App
[Section titled “Install the Cased Integration App”](#install-the-cased-integration-app)
1. Go to [app.cased.com/connections/github](https://app.cased.com/connections/github)
2. Select the GitHub option
3. Click “Install GitHub App”
4. Follow the GitHub authorization flow to grant the necessary permissions
## What the Integration Enables
[Section titled “What the Integration Enables”](#what-the-integration-enables)
The Cased Integration app enables:
* Repository access
* Workflow management
* Deployment monitoring
* Change tracking
# GitHub Actions Integration
> The Cased Deploy Notification Action is a one-line drop-in solution that automatically sends deployment events from your GitHub Actions workflows to Cased, enabling comprehensive monitoring and analysis of your deployments.
The Cased Deploy Notification Action is a one-line drop-in solution that automatically sends deployment events from your GitHub Actions workflows to Cased, enabling comprehensive monitoring and analysis of your deployments.
The [Cased Deploy Notification Action](https://github.com/cased/cased-deploy-notification-action) integrates seamlessly with your existing GitHub Actions workflows, providing automatic deployment tracking without requiring complex configuration or external dependencies.
## Features
[Section titled “Features”](#features)
* **One-line drop-in**: Just add the action to your workflow - no complex setup required
* **Automatic context**: Automatically fills repository and commit details from GitHub context
* **Flexible metadata**: Accepts custom JSON metadata and external URLs
* **Zero dependencies**: Simple HTTPS call to Cased with no external dependencies
* **Comprehensive tracking**: Links deployments to CI jobs and commit information
## Quick Start
[Section titled “Quick Start”](#quick-start)
Add the Cased Deploy Notification Action to any GitHub Actions workflow:
.github/workflows/deploy.yml
```yaml
name: Deploy
on:
workflow_dispatch:
push:
branches: [ main ]
jobs:
deploy:
runs-on: ubuntu-latest
steps:
- uses: actions/checkout@v4
# Your build & deploy steps here
- name: Notify Cased
uses: cased/cased-deploy-notification-action@v1
with:
api_key: ${{ secrets.CASED_API_KEY }}
event_metadata: '{"environment": "prod"}'
```
## Configuration
[Section titled “Configuration”](#configuration)
### Required Parameters
[Section titled “Required Parameters”](#required-parameters)
| Parameter | Description |
| --------- | --------------------------------------------------------- |
| `api_key` | Your Cased organization API key (store in GitHub secrets) |
### Optional Parameters
[Section titled “Optional Parameters”](#optional-parameters)
| Parameter | Default | Description |
| ---------------------- | -------------------------- | -------------------------------------------------------------------------- |
| `deployment_request` | auto-generated | Friendly description of the deployment |
| `repository_full_name` | `${{ github.repository }}` | Repository to attribute deployment to |
| `status` | `success` | Deployment status: `pending`, `running`, `success`, `failure`, `cancelled` |
| `event_metadata` | - | JSON string with custom metadata (environment, version, etc.) |
| `commit_sha` | `${{ github.sha }}` | Commit being deployed |
| `commit_message` | - | Commit message for the deployment |
| `external_url` | - | Link back to the deployment job or run |
| `cased_base_url` | `https://app.cased.com` | Alternate base URL (rarely needed) |
## Advanced Examples
[Section titled “Advanced Examples”](#advanced-examples)
### Multi-Environment Deployment
[Section titled “Multi-Environment Deployment”](#multi-environment-deployment)
```yaml
name: Deploy to Multiple Environments
on:
workflow_dispatch:
inputs:
environment:
description: 'Environment to deploy to'
required: true
type: choice
options: ['staging', 'production']
jobs:
deploy:
runs-on: ubuntu-latest
environment: ${{ inputs.environment }}
steps:
- uses: actions/checkout@v4
# Deploy steps here
- name: Notify Cased
uses: cased/cased-deploy-notification-action@v1
with:
api_key: ${{ secrets.CASED_API_KEY }}
deployment_request: "Deploy ${{ github.sha }} to ${{ inputs.environment }}"
event_metadata: |
{
"environment": "${{ inputs.environment }}",
"version": "${{ github.ref_name }}",
"deployer": "${{ github.actor }}"
}
external_url: "${{ github.server_url }}/${{ github.repository }}/actions/runs/${{ github.run_id }}"
```
### Conditional Deployment Notifications
[Section titled “Conditional Deployment Notifications”](#conditional-deployment-notifications)
```yaml
name: Conditional Deploy Notification
on:
push:
branches: [ main, develop ]
jobs:
deploy:
runs-on: ubuntu-latest
steps:
- uses: actions/checkout@v4
# Deploy steps here
- name: Notify Cased (Production)
if: github.ref == 'refs/heads/main'
uses: cased/cased-deploy-notification-action@v1
with:
api_key: ${{ secrets.CASED_API_KEY }}
event_metadata: '{"environment": "production"}'
- name: Notify Cased (Staging)
if: github.ref == 'refs/heads/develop'
uses: cased/cased-deploy-notification-action@v1
with:
api_key: ${{ secrets.CASED_API_KEY }}
event_metadata: '{"environment": "staging"}'
```
### Deployment Status Tracking
[Section titled “Deployment Status Tracking”](#deployment-status-tracking)
```yaml
name: Deploy with Status Tracking
on:
workflow_dispatch:
jobs:
deploy:
runs-on: ubuntu-latest
steps:
- uses: actions/checkout@v4
- name: Notify Deployment Started
uses: cased/cased-deploy-notification-action@v1
with:
api_key: ${{ secrets.CASED_API_KEY }}
status: "running"
deployment_request: "Starting deployment of ${{ github.sha }}"
event_metadata: '{"environment": "production", "phase": "start"}'
# Your deployment steps here
- name: Notify Deployment Success
if: success()
uses: cased/cased-deploy-notification-action@v1
with:
api_key: ${{ secrets.CASED_API_KEY }}
status: "success"
deployment_request: "Successfully deployed ${{ github.sha }}"
event_metadata: '{"environment": "production", "phase": "complete"}'
- name: Notify Deployment Failure
if: failure()
uses: cased/cased-deploy-notification-action@v1
with:
api_key: ${{ secrets.CASED_API_KEY }}
status: "failure"
deployment_request: "Failed to deploy ${{ github.sha }}"
event_metadata: '{"environment": "production", "phase": "failed"}'
```
## API Key Setup
[Section titled “API Key Setup”](#api-key-setup)
1. **Generate API Key**: Go to your Cased organization settings → API Keys
2. **Add to GitHub Secrets**: In your repository, go to Settings → Secrets and variables → Actions
3. **Create Secret**: Add a new secret named `CASED_API_KEY` with your API key value
## How It Works
[Section titled “How It Works”](#how-it-works)
The action runs a lightweight Python container that sends a POST request to Cased’s deployment API:
```plaintext
POST /api/v1/deployments/
Authorization: Token
```
The payload includes all the deployment information, and Cased automatically:
* Records the deployment event
* Triggers monitoring and notifications
* Links the deployment to your repository and commit
* Starts post-deployment health checks
## Integration Benefits
[Section titled “Integration Benefits”](#integration-benefits)
### Deployment Tracking
[Section titled “Deployment Tracking”](#deployment-tracking)
* **Complete History**: Track all deployments across environments
* **Commit Correlation**: Link deployments to specific commits and changes
* **Environment Visibility**: See deployment status across all environments
### Monitoring Integration
[Section titled “Monitoring Integration”](#monitoring-integration)
* **Automatic Monitoring**: Cased automatically starts monitoring after deployment notifications
* **Performance Tracking**: Monitor application performance post-deployment
* **Issue Detection**: Detect anomalies and issues related to deployments
### Team Collaboration
[Section titled “Team Collaboration”](#team-collaboration)
* **Slack Notifications**: Automatic notifications to team channels
* **Deployment Dashboards**: Visual deployment tracking in Mission Control
* **Audit Trail**: Complete audit trail of who deployed what and when
## Best Practices
[Section titled “Best Practices”](#best-practices)
1. **Use Secrets**: Always store your API key in GitHub secrets, never in code
2. **Meaningful Metadata**: Include relevant information like environment, version, and deployer
3. **Status Tracking**: Use different statuses to track deployment lifecycle
4. **External URLs**: Link back to GitHub Actions runs for easy debugging
5. **Consistent Naming**: Use consistent deployment request naming across workflows
## Troubleshooting
[Section titled “Troubleshooting”](#troubleshooting)
### Common Issues
[Section titled “Common Issues”](#common-issues)
**Action fails with authentication error**
* Verify your API key is correct and stored in GitHub secrets
* Check that the secret name matches what you’re using in the workflow
**Deployment not showing in Cased**
* Ensure the API key has proper permissions
* Check the repository name matches your Cased project configuration
**Missing deployment details**
* Verify the `event_metadata` is valid JSON
* Check that required parameters are properly set
The Cased Deploy Notification Action provides seamless integration between your GitHub Actions workflows and Cased’s comprehensive deployment monitoring and management platform.
# Groundcover
> Connect Cased to Groundcover for Kubernetes monitoring and observability
Connect Cased to Groundcover for Kubernetes monitoring and observability
# Groundcover
[Section titled “Groundcover”](#groundcover)
Groundcover is a Kubernetes monitoring and observability platform that provides comprehensive insights into your cluster’s health, performance, and resource utilization. Cased integrates with Groundcover to help you query cluster information, discover resources, and monitor node metrics.
## Available Actions
[Section titled “Available Actions”](#available-actions)
With Groundcover connected, Cased agents can handle:
* **Cluster Discovery**: List and explore Kubernetes clusters monitored by Groundcover
* **Resource Discovery**: List namespaces, workloads, deployments, and nodes in your cluster
* **Node Monitoring**: Query resource utilization metrics (CPU, memory, capacity) for cluster nodes
* **Cluster Topology**: Understand cluster organization and resource structure
* **Troubleshooting**: Investigate node resource pressure and capacity issues
## Setup
[Section titled “Setup”](#setup)
To connect Groundcover to Cased, you’ll need an API Key and Backend ID.
### Step 1: Create an API Key
[Section titled “Step 1: Create an API Key”](#step-1-create-an-api-key)
1. In Groundcover, click the settings button in the bottom left corner
2. Select “Access” from the sidebar menu
3. Click on the “API Keys” tab
4. Create a new API key and assign it to a service account with appropriate RBAC permissions
5. Copy the API key (it will only be displayed once)
### Step 2: Find Your Backend ID
[Section titled “Step 2: Find Your Backend ID”](#step-2-find-your-backend-id)
1. In Groundcover, go to Settings → Access → API Keys
2. Your Backend ID (cluster identifier) is displayed on this page
3. Copy the Backend ID
Alternatively, for multi-backend setups:
* Open Data Explorer in Groundcover
* Click the Backend picker in the top-right corner
* Copy the backend’s name/ID
## Connect to Cased
[Section titled “Connect to Cased”](#connect-to-cased)
1. Go to [app.cased.com/connections/groundcover](https://app.cased.com/connections/groundcover)
2. Enter your API Key and Backend ID
3. Cased agent will start using the Groundcover connection
## Agent Triggers
[Section titled “Agent Triggers”](#agent-triggers)
Cased can automatically trigger agents when Groundcover alerts fire. This enables automated incident response for Kubernetes issues like:
* Pod crashes and CrashLoopBackOff
* Resource exhaustion (OOMKilled, CPU throttling)
* Configuration errors (missing secrets, invalid image references)
* Node pressure and capacity issues
### Setting Up Webhook Triggers
[Section titled “Setting Up Webhook Triggers”](#setting-up-webhook-triggers)
1. **Get your Cased webhook URL**:
* Go to your organization’s settings in Cased
* Find your API key
* Your webhook URL is: `https://app.cased.com/webhooks//groundcover/`
2. **Configure Groundcover to send alerts**:
* In Groundcover, go to Settings → Integrations → Notifications
* Click “Webhook” to create a new webhook integration
* Give it a name (e.g., `cased`)
* Enter your webhook URL: `https://app.cased.com/webhooks//groundcover/`
* No additional headers are required
* Click Save
3. **Create an agent in Cased**:
* Go to [app.cased.com/agents](https://app.cased.com/agents)
* Click “Create Agent”
* Under triggers, select “Groundcover” and choose “Alert fired”
* Configure your agent instructions
### Pre-built Agent Template
[Section titled “Pre-built Agent Template”](#pre-built-agent-template)
Cased includes a **Kubernetes Error Analyzer** template that automatically:
* Classifies alerts (configuration errors, resource exhaustion, runtime issues)
* Gathers diagnostic information from kubectl and monitoring tools
* Identifies root cause and impacted resources
* Reports findings to Slack
* Spawns fix sessions for configuration errors
To use the template, select “Kubernetes Error Analyzer” when creating a new agent.
### Alert Context
[Section titled “Alert Context”](#alert-context)
When a Groundcover alert triggers an agent, Cased provides the following context variables:
| Variable | Description |
| ------------- | ---------------------------------------- |
| `alert_title` | The alert title |
| `alert_name` | The alertname label |
| `severity` | Alert severity (critical, warning, info) |
| `cluster_id` | The Groundcover backend/cluster ID |
| `description` | Alert description from annotations |
| `labels` | All alert labels |
| `annotations` | All alert annotations |
# Honeycomb
> Connect Cased to Honeycomb to monitor your application's metrics, traces, and logs in one unified observability platform
Connect Cased to Honeycomb to monitor your application's metrics, traces, and logs in one unified observability platform
# Honeycomb
[Section titled “Honeycomb”](#honeycomb)
Honeycomb offers three types of API keys:
## API Key Types
[Section titled “API Key Types”](#api-key-types)
### Ingest Keys
[Section titled “Ingest Keys”](#ingest-keys)
* For sending data to Honeycomb
* Environment-scoped
* Used by applications to send telemetry
### Configuration Keys (Cased requires this)
[Section titled “Configuration Keys (Cased requires this)”](#configuration-keys-cased-requires-this)
* For reading and modifying Honeycomb settings
* Environment-scoped
* Manages datasets and resources
### Management Keys
[Section titled “Management Keys”](#management-keys)
* For organization-wide administration
* Not environment-scoped
* Highest level of access
## Generate a Configuration Key
[Section titled “Generate a Configuration Key”](#generate-a-configuration-key)
Cased requires a Configuration key to access your Honeycomb data. This is because Cased needs to:
* Read your datasets to monitor application performance
* Access environment information to track changes
* Query team information for proper access control
To generate the required Configuration key:
1. Navigate to your Honeycomb environment settings or visit [Honeycomb API Keys](https://ui.honeycomb.io/environments)
2. Click the ‘Create Configuration API Key’ button
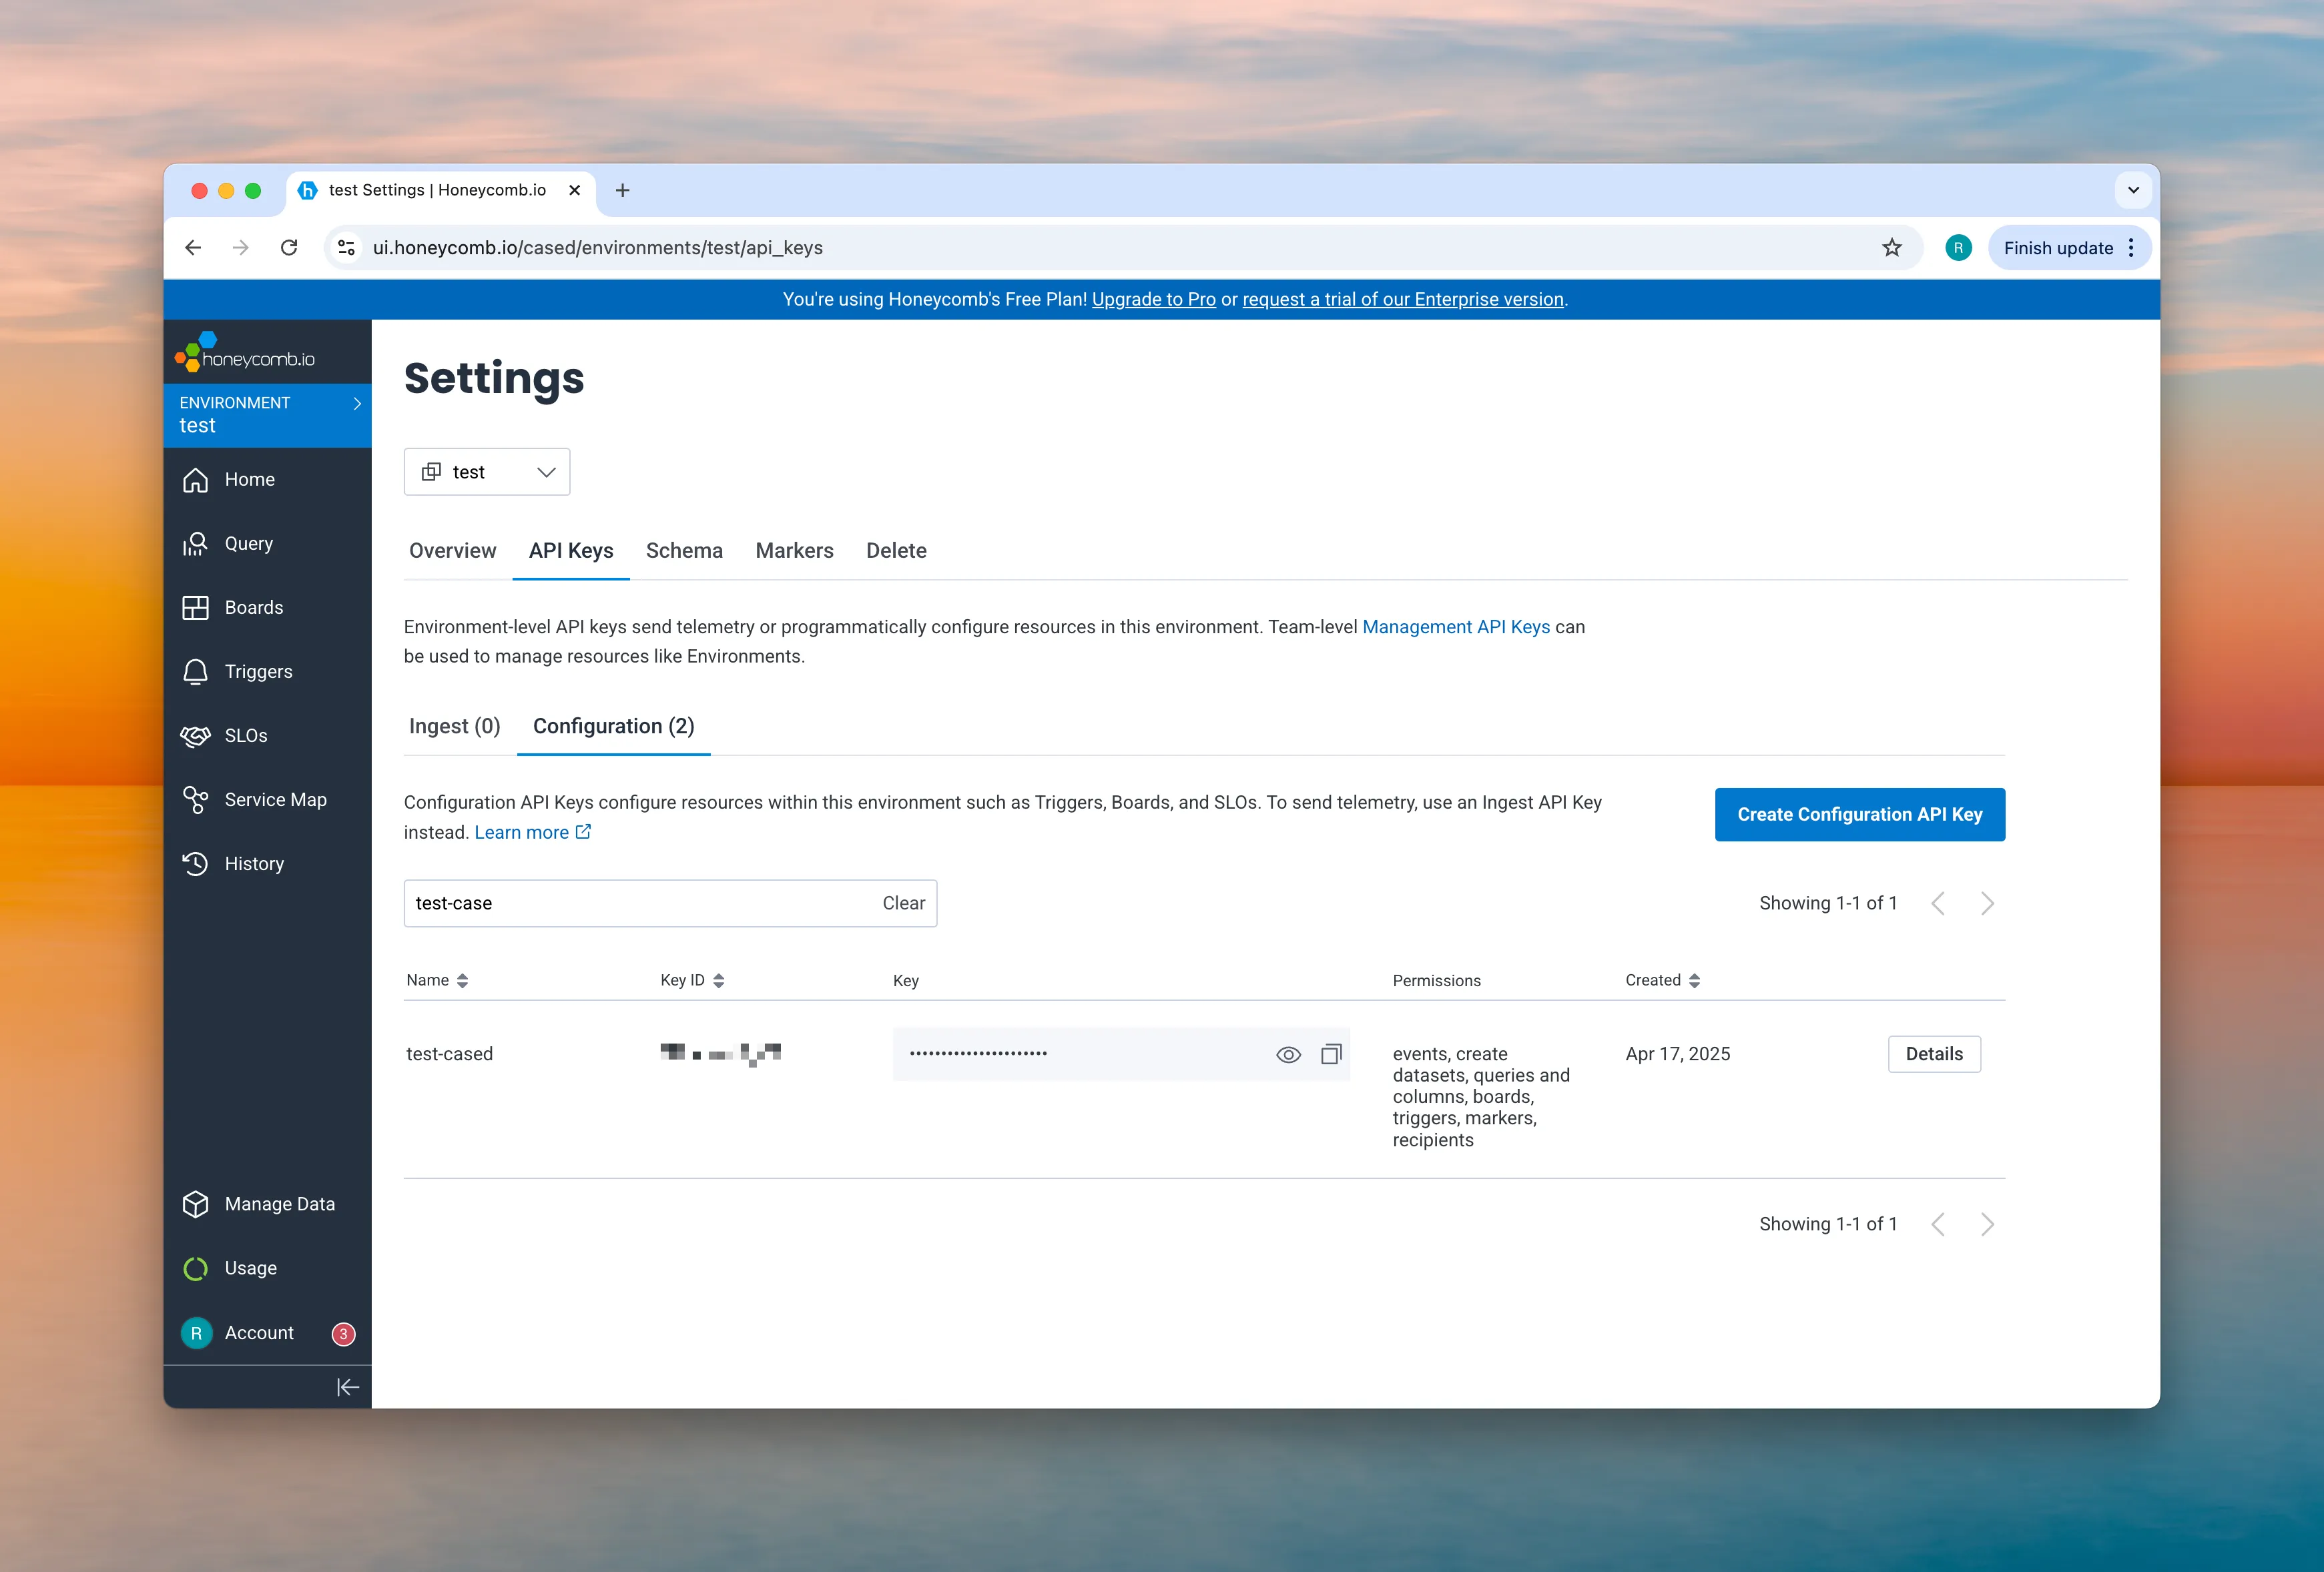
3. Give your API key a name, like `cased`
4. Check the following permissions:
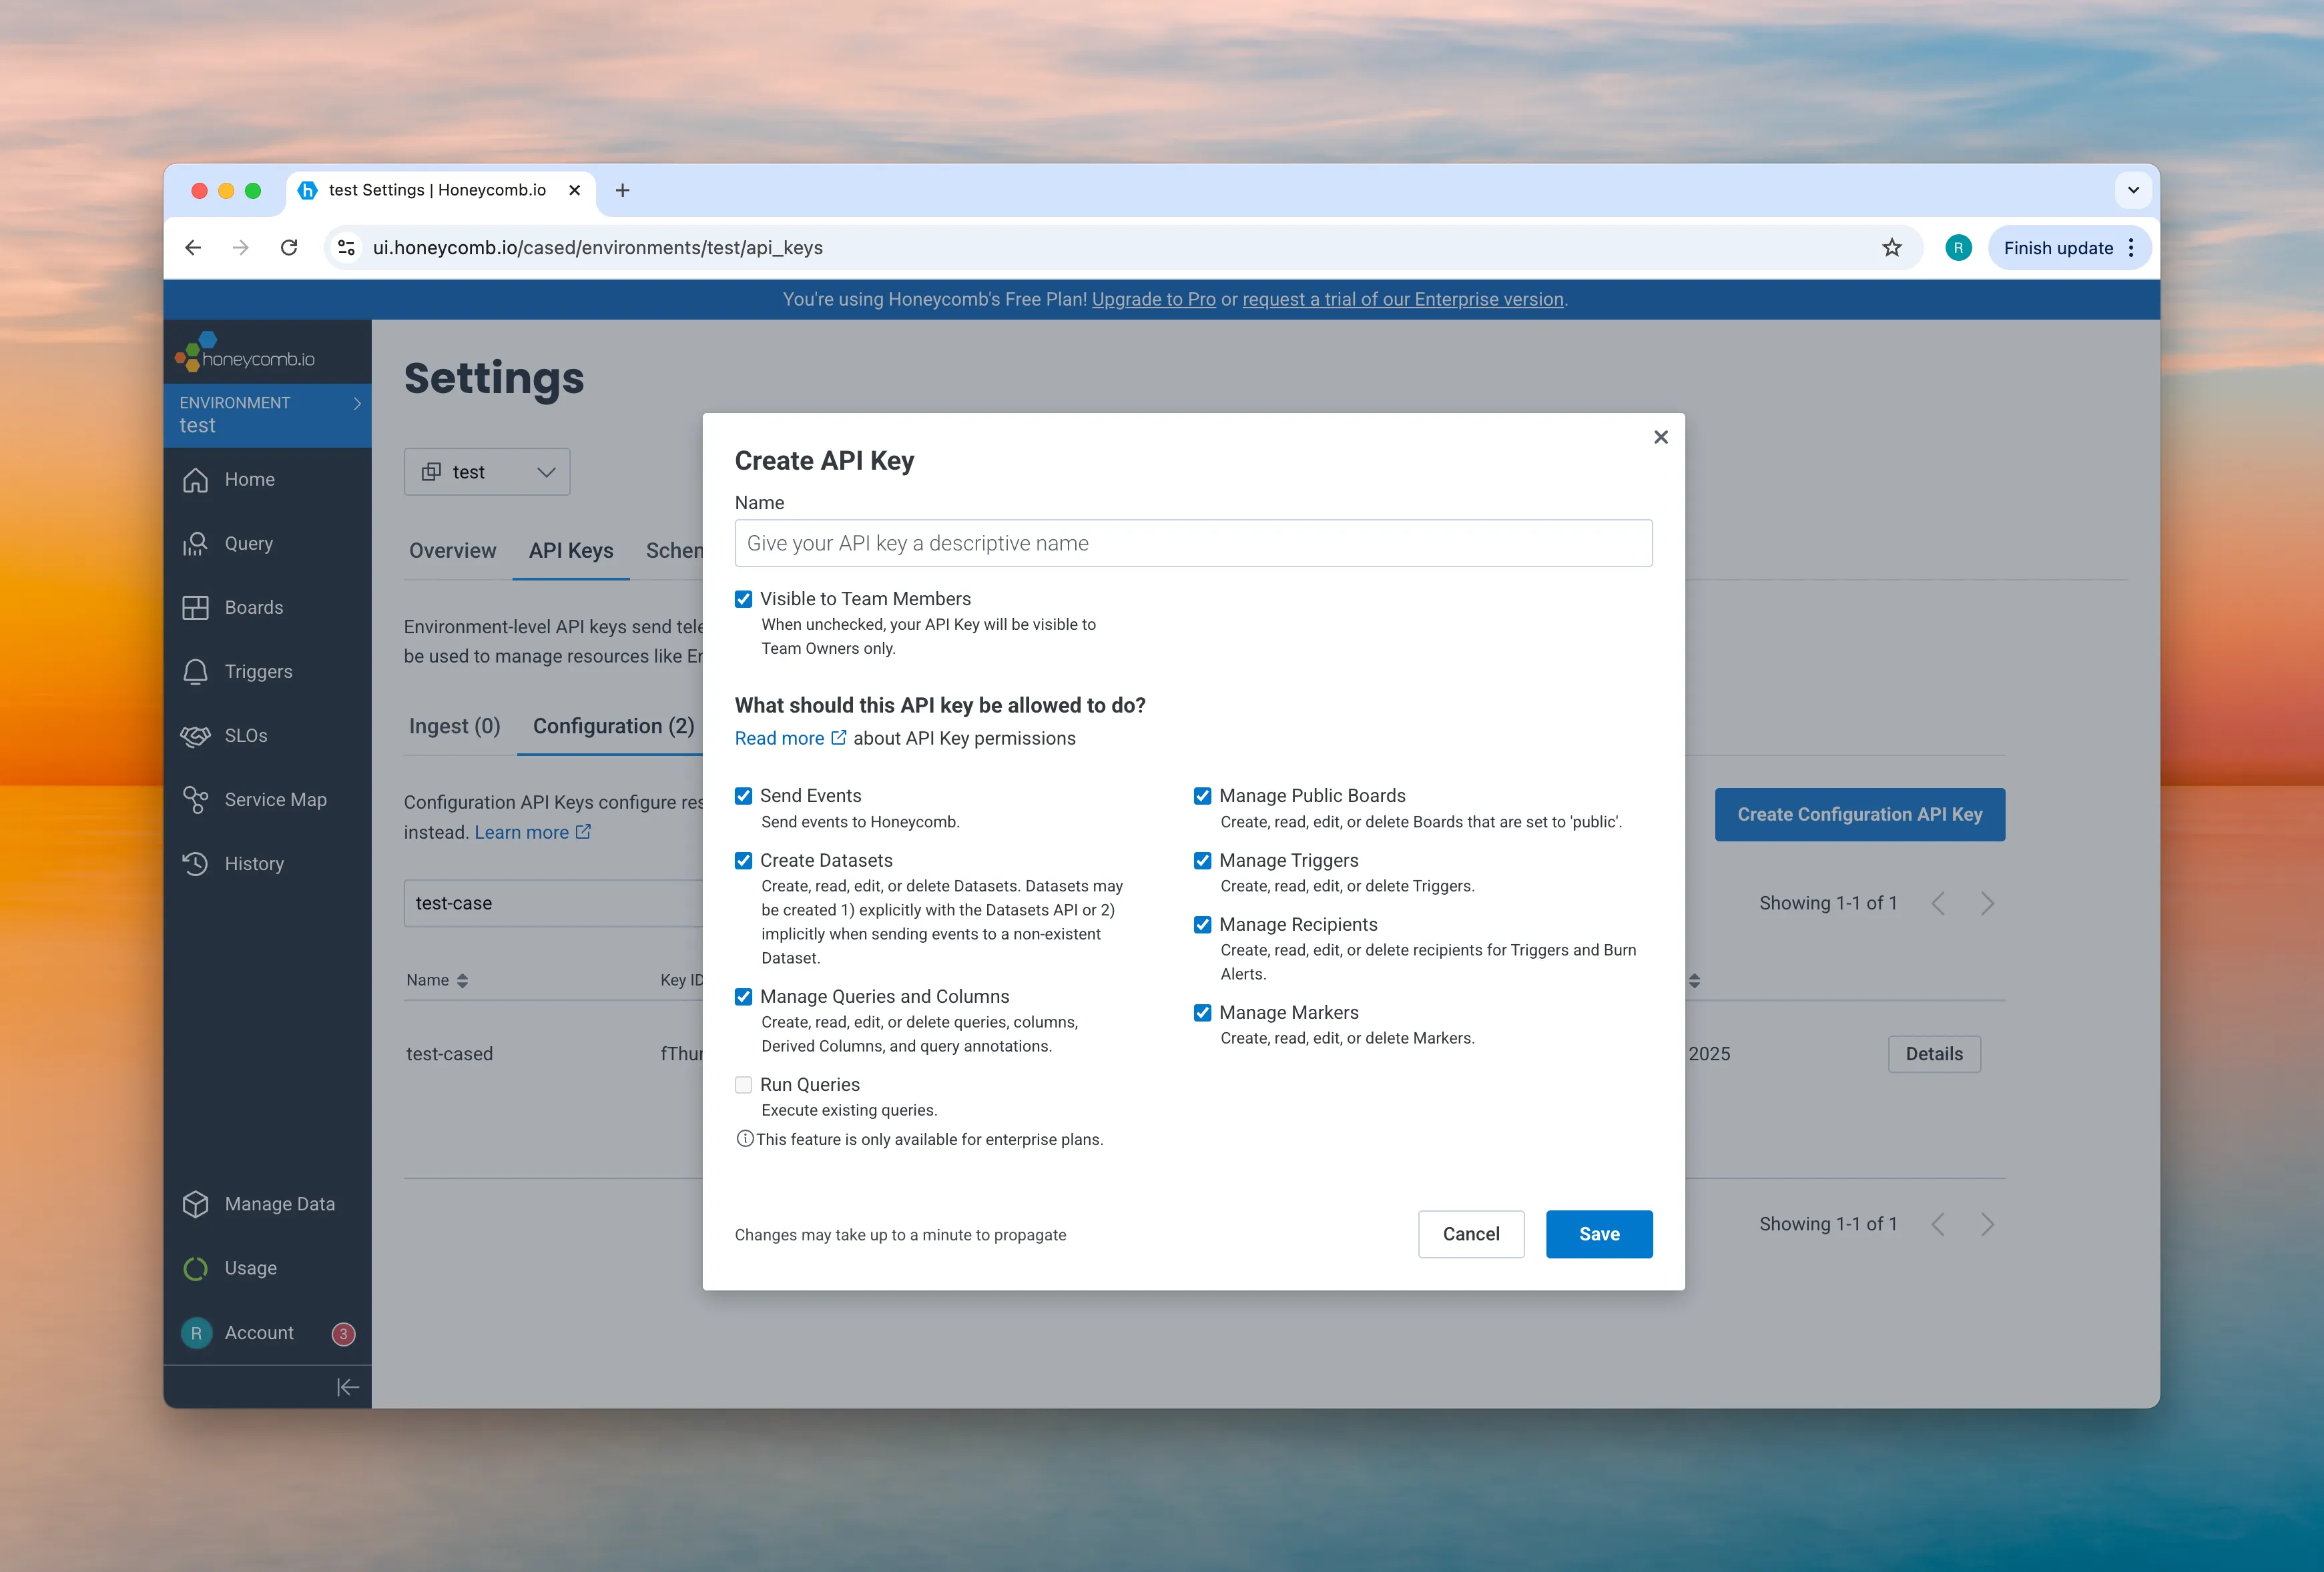
5. Enter the generated API key on Cased at [app.cased.com/connections/honeycomb.io](https://app.cased.com/connections/honeycomb.io)
## Configure Environment
[Section titled “Configure Environment”](#configure-environment)
1. In your Honeycomb environment settings, note your environment name
2. Enter this environment name in Cased’s Honeycomb connection settings
## API Key Scopes
[Section titled “API Key Scopes”](#api-key-scopes)
The Configuration key requires access to:
* Query and retrieve data from your datasets
* Access environment information
We recommend not restricting the API key’s access to specific datasets so Cased agent can provide comprehensive monitoring and debugging capabilities.
# Jira
> Connect Cased to Jira to manage your projects and issues
Connect Cased to Jira to manage your projects and issues
# Jira
[Section titled “Jira”](#jira)
To connect to Jira, you will need your Jira domain, email, and an API token.
## Obtain Your Jira Domain
[Section titled “Obtain Your Jira Domain”](#obtain-your-jira-domain)
1. Log in to your Jira account
2. Your Jira domain is the URL of your Jira instance (e.g., `https://your-company.atlassian.net`)
## Generate an API Token
[Section titled “Generate an API Token”](#generate-an-api-token)
1. Log in to your [Atlassian Account](https://id.atlassian.com/manage/api-tokens)
2. Click “Create API token”
3. Give your token a name (e.g., “Cased Integration”)
4. Click “Create”
5. Copy the generated API token immediately, as it will only be shown once
## Connect to Cased
[Section titled “Connect to Cased”](#connect-to-cased)
1. Go to [app.cased.com/connections/jira](https://app.cased.com/connections/jira)
2. Enter the following information:
* Jira Domain (e.g., `your-company.atlassian.net`)
* Email (the email associated with your Jira account)
* API Token (the token you generated in Step 5)
3. Cased agent will start using the Jira connection.
# Linear
> Connect Cased to Linear to manage your projects and tasks
Connect Cased to Linear to manage your projects and tasks
# Linear
[Section titled “Linear”](#linear)
To connect to Linear, you will need to generate a Personal API key.
## Generate a Personal API Key
[Section titled “Generate a Personal API Key”](#generate-a-personal-api-key)
1. Go to Settings -> API Settings
2. Scroll down until you see Personal API Keys
3. You will be prompted to enter a label for the key
4. Type in a label that helps you identify this key’s purpose (e.g., “cased-app”)
## Connect to Cased
[Section titled “Connect to Cased”](#connect-to-cased)
1. Go to [app.cased.com/connections/linear](https://app.cased.com/connections/linear)
2. Enter your Linear Personal API key
3. Cased agent will start using the Linear connection.
# Notion
> Connect Cased to Notion to import your documentation and knowledge base
Connect Cased to Notion to import your documentation and knowledge base
# Notion
[Section titled “Notion”](#notion)
Connect Cased to Notion to import your documentation, runbooks, and knowledge base articles for your AI agents to reference.
## Create an Integration
[Section titled “Create an Integration”](#create-an-integration)
1. Go to [Notion Integrations](https://www.notion.so/my-integrations)
2. Click “New integration”
3. Give your integration a name (e.g., “Cased Integration”)
4. Select the workspace where you want to use the integration
5. Click “Submit”
6. Copy the “Internal Integration Token” (this is your integration secret)
7. The integration secret will only be shown once, so make sure to copy it immediately
## Share Your Notion Pages
[Section titled “Share Your Notion Pages”](#share-your-notion-pages)
Before Cased can access your Notion content, you must explicitly share pages with the integration:
1. Open the Notion pages you want to share with Cased
2. Click the ”…” menu in the top-right corner
3. Go to “Add connections”
4. Select your Cased integration from the list
You can share individual pages or entire databases. Only pages explicitly shared with the integration will be accessible.
## Connect to Cased
[Section titled “Connect to Cased”](#connect-to-cased)
1. Go to [app.cased.com/connections/notion](https://app.cased.com/connections/notion)
2. Enter your Notion integration secret
3. Click “Save” to validate and store your connection
## Import Your Pages
[Section titled “Import Your Pages”](#import-your-pages)
After connecting, you need to import your Notion pages into Cased’s knowledge base:
1. Go to [app.cased.com/docs](https://app.cased.com/docs)
2. Click “Import from Notion”
3. Optionally enter a search query to filter pages (e.g., “runbook”, “oncall”)
4. Set the maximum number of pages to import
5. Click “Import Pages”
Your imported pages will now be available to Cased agents when answering questions or investigating issues.
Tip
You can re-import pages at any time to sync updates from Notion. Each import will update existing pages and add new ones.
# PagerDuty
> Connect Cased to PagerDuty to manage incidents and alerts
Connect Cased to PagerDuty to manage incidents and alerts
# PagerDuty
[Section titled “PagerDuty”](#pagerduty)
To use PagerDuty, we just need a single API key, which is easy to create.
## Generate an API Key
[Section titled “Generate an API Key”](#generate-an-api-key)
1. Visit [PagerDuty API Keys](https://pagerduty.com/api_keys)
2. Create a new API key
3. Do not select a read-only API key
4. The API key should have write permissions so that we can create the event webhook
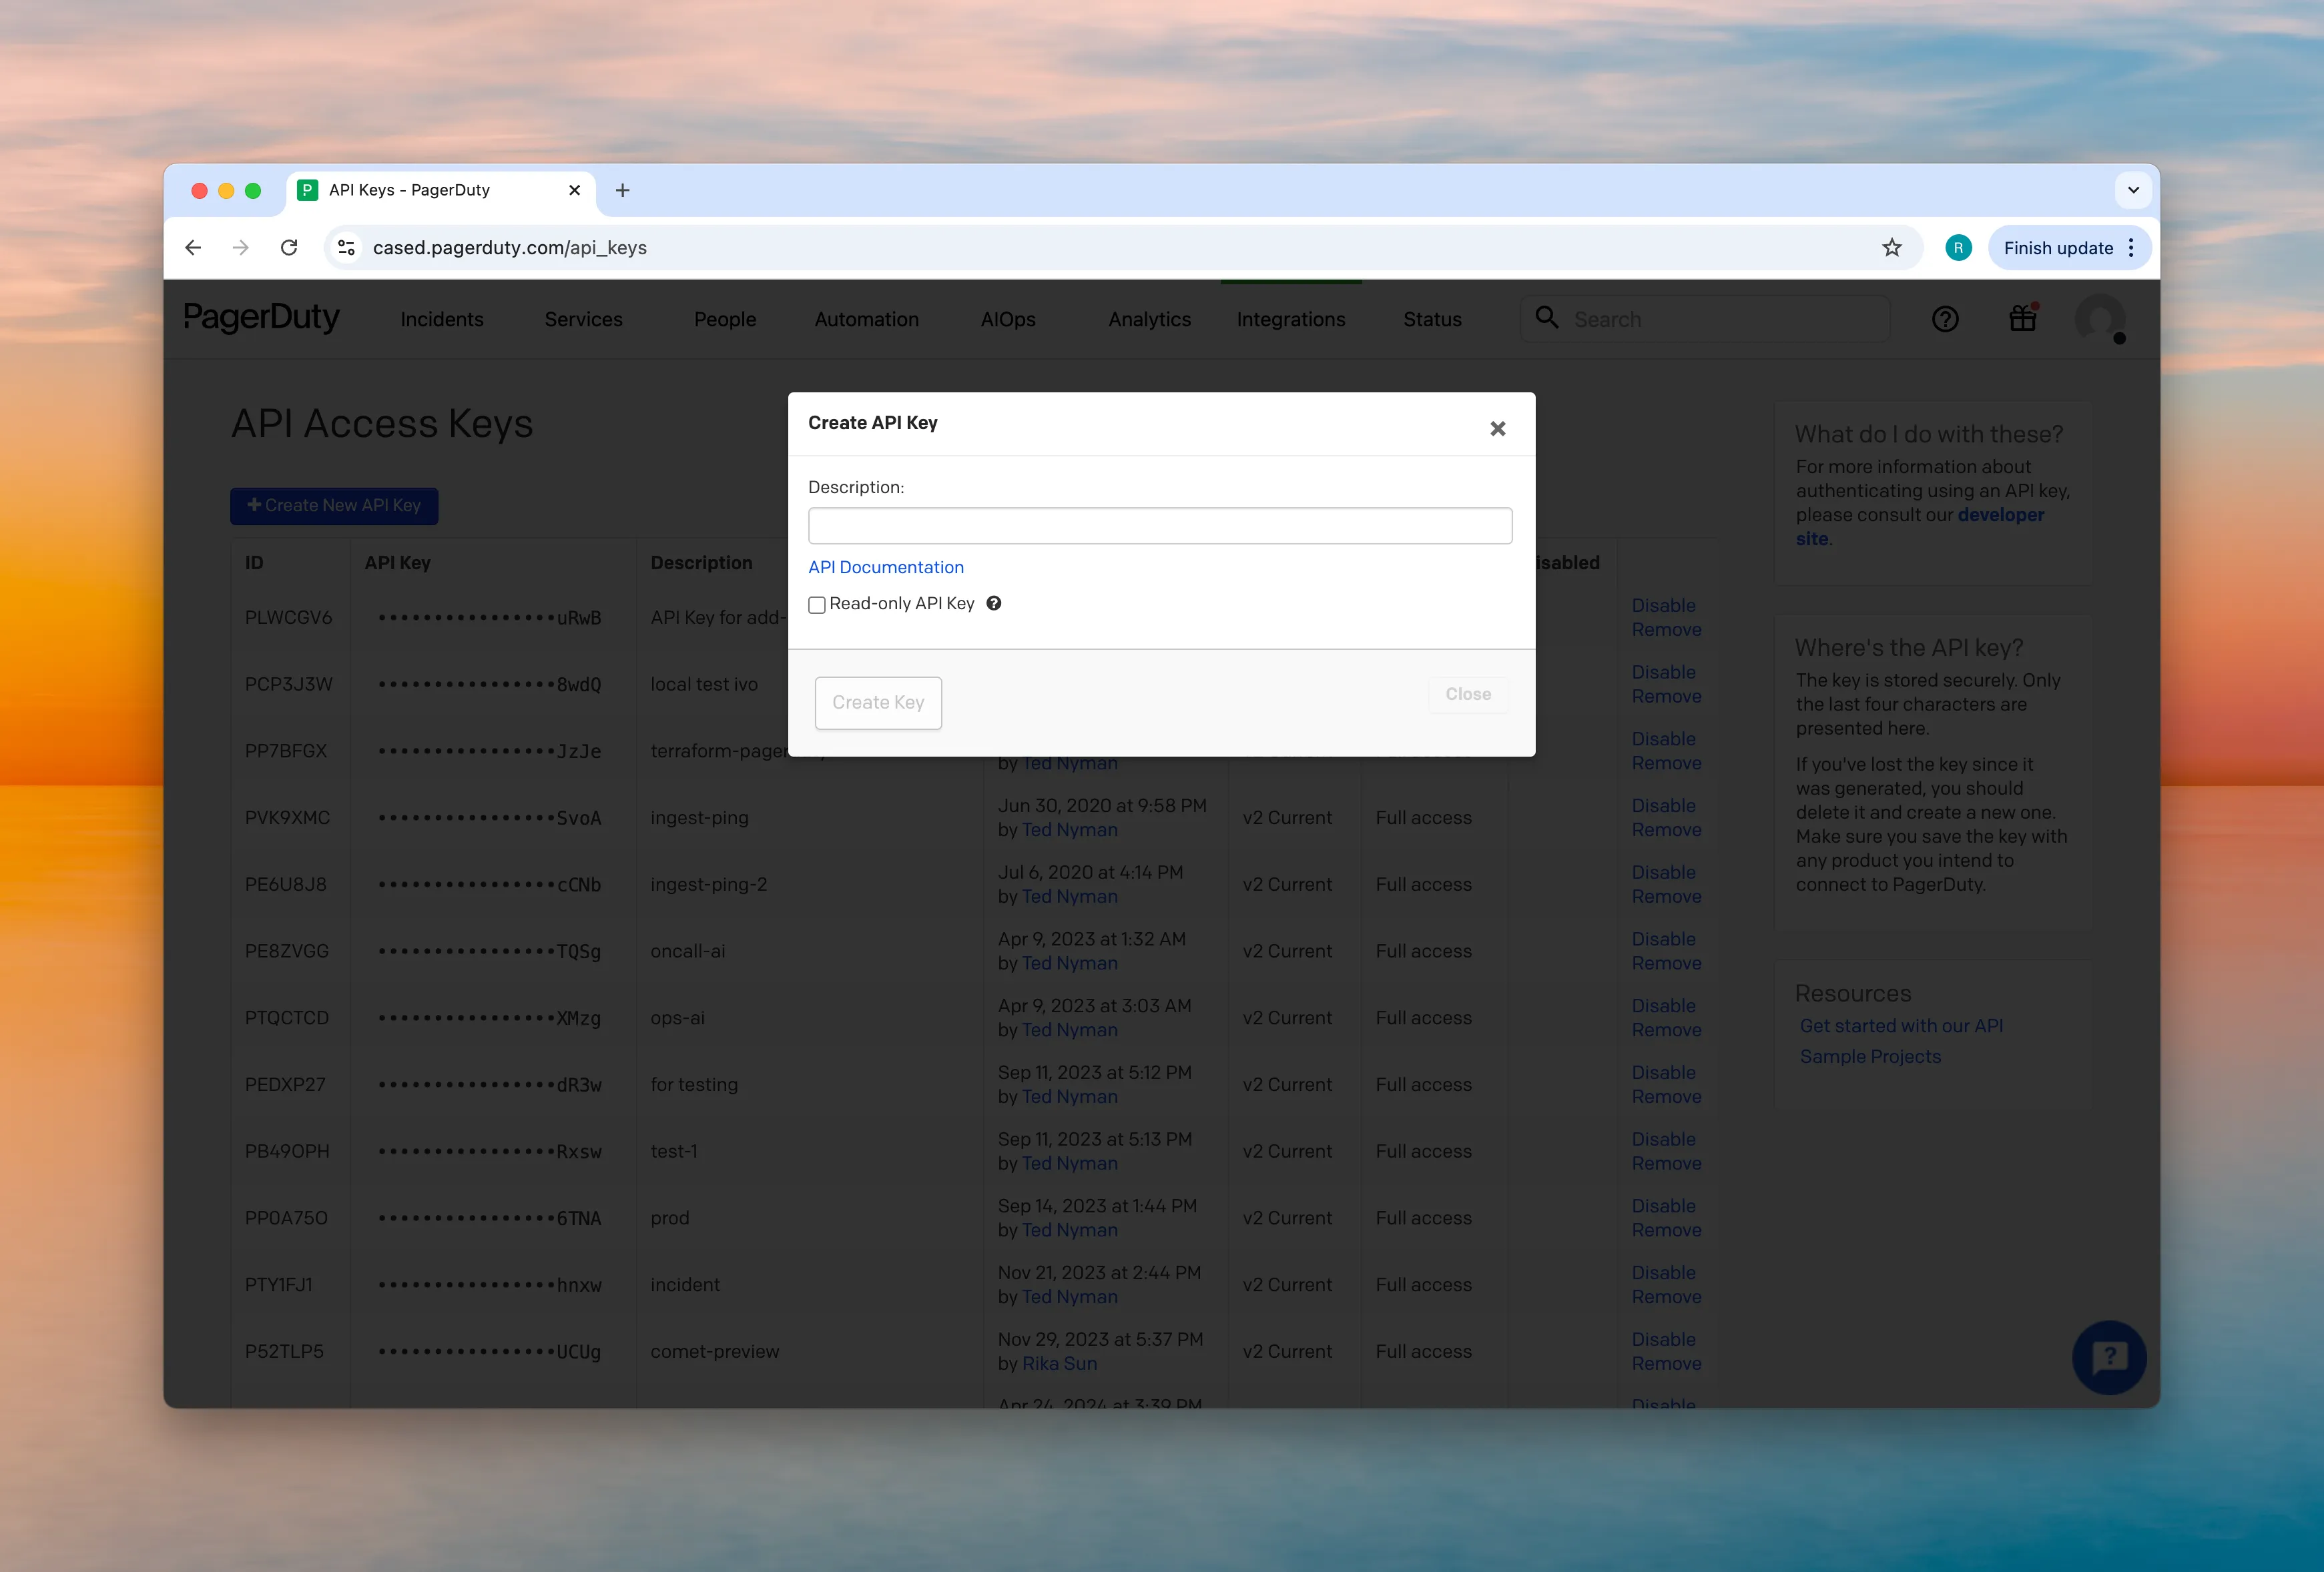
## Connect to Cased
[Section titled “Connect to Cased”](#connect-to-cased)
1. Go to [app.cased.com/connections/pagerduty](https://app.cased.com/connections/pagerduty)
2. Enter your PagerDuty API key
3. Enter your default service name (e.g., “Production” or “Main Service”)
4. Cased will automatically configure webhooks to receive PagerDuty incident events
5. Cased agent will start using the PagerDuty connection.
## Agent Triggers
[Section titled “Agent Triggers”](#agent-triggers)
Once connected, PagerDuty can trigger automated agents based on incident events. This allows you to automatically respond to incidents, gather diagnostics, notify teams, or even attempt automated remediation.
### Available Trigger Events
[Section titled “Available Trigger Events”](#available-trigger-events)
PagerDuty agents can be triggered by the following incident events:
* **Incident Triggered** - Fires when a new incident is created
* **Incident Acknowledged** - Fires when someone acknowledges an incident
* **Incident Resolved** - Fires when an incident is marked as resolved
### Setting Up a PagerDuty Agent
[Section titled “Setting Up a PagerDuty Agent”](#setting-up-a-pagerduty-agent)
1. Navigate to your project’s Agents page
2. Create a new agent or edit an existing one
3. In the Trigger section, select “PagerDuty”
4. Choose which incident events should trigger this agent
5. Configure your agent instructions to handle the incident
### Example Use Cases
[Section titled “Example Use Cases”](#example-use-cases)
* **Auto-diagnostics**: When an incident triggers, automatically gather logs, metrics, and system status
* **Team notifications**: Send custom notifications to Slack or other channels with incident details
* **Runbook automation**: Execute predefined runbooks based on the incident type or service
* **Post-incident actions**: When an incident resolves, create a post-mortem document or update status pages
### Agent Context
[Section titled “Agent Context”](#agent-context)
When a PagerDuty incident triggers an agent, the following context is available:
* `incident_number` - The PagerDuty incident number
* `incident_title` - Title/description of the incident
* `incident_urgency` - Urgency level (high, low)
* `incident_url` - Direct link to the incident in PagerDuty
* `service` - The affected service name
This context can be used in your agent instructions to create targeted responses based on the specific incident details.
# PlanetScale
> Connect Cased to PlanetScale to manage your databases, branches, and deploy requests
Connect Cased to PlanetScale to manage your databases, branches, and deploy requests
# PlanetScale
[Section titled “PlanetScale”](#planetscale)
PlanetScale is a database-as-a-service platform that provides branching for databases. Cased integrates with PlanetScale to help you manage databases, monitor deploy requests, and track schema changes.
## Available Actions
[Section titled “Available Actions”](#available-actions)
With PlanetScale connected, Cased agents can:
* **Database Management**: List databases, get database details, and monitor database health
* **Branch Operations**: List branches, get branch details, and track branch readiness
* **Schema Monitoring**: Retrieve database schemas and track schema changes
* **Deploy Requests**: Monitor deploy requests, check deploy queues, and track deployment status
* **Backup Management**: List and monitor database backups
* **Connection Testing**: Verify PlanetScale connection status
## Setup
[Section titled “Setup”](#setup)
For PlanetScale, we need a service token ID and a service token. These are straightforward to add. Make sure to pay attention to the scopes when you create the tokens.
## Generate Service Tokens
[Section titled “Generate Service Tokens”](#generate-service-tokens)
1. Click on “Settings” on the left-side nav panel (make sure it’s your org settings, e.g. app.planetscale.com/your-org/settings
2. Click on “Service Tokens” in the left-hand menu
3. Click on the “New token” button
4. Make sure to grant the service token the Read permission for the organization and databases you want to use it with. The more you add, the better Cased can do. In particular, granting metrics access under the Organization allows Cased to find important query patterns.
5. After creation, you will be presented with a SERVICE\_TOKEN\_ID and a SERVICE\_TOKEN
You can also do this via the `pscale` CLI.
## Important Security Note
[Section titled “Important Security Note”](#important-security-note)
For security reasons, the service token is only shown once and cannot be retrieved later. If you lose your service token, you will need to create a new one.
## Connect to Cased
[Section titled “Connect to Cased”](#connect-to-cased)
1. Go to [app.cased.com/connections/planetscale](https://app.cased.com/connections/planetscale)
2. Enter your PlanetScale SERVICE\_TOKEN\_ID and SERVICE\_TOKEN
3. Cased agent will start using the PlanetScale connection.
# PostHog
> Connect Cased to PostHog to analyze product usage and user behavior
Connect Cased to PostHog to analyze product usage and user behavior
# PostHog
[Section titled “PostHog”](#posthog)
PostHog is an open-source product analytics platform that helps teams understand user behavior, track events, and analyze product usage.
To connect Cased to PostHog, you’ll need to configure your PostHog instance details and generate an API key.
## Choose your PostHog deployment
[Section titled “Choose your PostHog deployment”](#choose-your-posthog-deployment)
PostHog offers three deployment options:
1. **US Cloud** - Hosted at app.posthog.com (default)
2. **EU Cloud** - Hosted at eu.posthog.com
3. **Self-hosted** - Your own PostHog instance
## Generate an API key
[Section titled “Generate an API key”](#generate-an-api-key)
### For PostHog Cloud (US or EU)
[Section titled “For PostHog Cloud (US or EU)”](#for-posthog-cloud-us-or-eu)
1. Navigate to your PostHog dashboard at [app.posthog.com](https://app.posthog.com) or [eu.posthog.com](https://eu.posthog.com)
2. Click on your project settings (gear icon)
3. Navigate to **Project Settings > Project Variables**
4. Find your **Project API Key** or create a **Personal API Key** under **Personal API Keys**
5. Copy the API key
### For self-hosted PostHog
[Section titled “For self-hosted PostHog”](#for-self-hosted-posthog)
1. Access your PostHog instance dashboard
2. Navigate to **Project Settings > Project Variables**
3. Find your **Project API Key** or create a **Personal API Key**
4. Note your instance URL (e.g., `https://posthog.example.com`)
## Configure in Cased
[Section titled “Configure in Cased”](#configure-in-cased)
1. Go to [app.cased.com/connections/posthog](https://app.cased.com/connections/posthog)
2. Select your PostHog region:
* **US Cloud** for app.posthog.com
* **EU Cloud** for eu.posthog.com
* **Self-hosted** for your own instance
3. If using self-hosted, enter your PostHog instance URL
4. Enter your **Project ID** (found in PostHog project settings)
5. Enter your **API Key**
6. Click **Save** to complete the integration
## What Cased can access
[Section titled “What Cased can access”](#what-cased-can-access)
With the PostHog integration, Cased can:
* List and analyze events from your product
* Query user behavior and activity patterns
* Access feature flag configurations
* View insights and dashboards
* Retrieve user cohorts and segments
* Query data using HogQL for custom analytics
This enables Cased to provide intelligent insights about your product usage, help debug user issues, and understand feature adoption.
# Prometheus
> Connect Cased to Prometheus to monitor your metrics
Connect Cased to Prometheus to monitor your metrics
# Prometheus
[Section titled “Prometheus”](#prometheus)
Unlike other integrations, Prometheus is typically deployed within your private infrastructure. We’ll work with you to establish secure access to your metrics.
## Getting Started
[Section titled “Getting Started”](#getting-started)
Since every infrastructure setup is unique, we recommend reaching out to our team to:
* Discuss your current Prometheus deployment
* Plan the most secure way to access your metrics
* Set up appropriate network policies and authentication
Contact us at to get started.
## Configure Connection
[Section titled “Configure Connection”](#configure-connection)
Once we’ve established the best approach for your setup:
1. Go to [app.cased.com/connections/prometheus](https://app.cased.com/connections/prometheus)
2. Enter your Prometheus endpoint URL
## Security
[Section titled “Security”](#security)
We understand the sensitivity of your metrics and infrastructure. Our team will work with you to ensure:
* Secure access to your Prometheus instance
* Appropriate authentication methods
* Proper network policies and controls
# Render
> Connect Cased to Render to deploy services, monitor infrastructure, and manage your cloud applications
Connect Cased to Render to deploy services, monitor infrastructure, and manage your cloud applications
# Render
[Section titled “Render”](#render)
Render is a unified cloud platform to build and run all your apps and websites with free TLS certificates, global CDN, private networks and auto deploys from Git. Cased integrates with Render to help you manage deployments, monitor services, and track your cloud infrastructure.
## Available Actions
[Section titled “Available Actions”](#available-actions)
With Render connected, Cased agents can handle:
* **Service Management**: List and monitor web services, background workers, cron jobs, and static sites
* **Service Control**: Suspend, resume, and restart services
* **Database Operations**: Manage PostgreSQL and Redis instances with connection information
* **Deployment Control**: Trigger deployments, cancel in-progress deploys, list deployment history
* **Metrics & Monitoring**: Access detailed CPU, memory, HTTP latency, bandwidth, and disk metrics
* **Environment Management**: Work with environment groups for shared configurations
* **Domain Management**: List and manage custom domains across services
## Setup
[Section titled “Setup”](#setup)
To connect Render to Cased:
1. Visit
2. Navigate to the API Keys section
3. Create a new API key with appropriate permissions for your organization
## Connect to Cased
[Section titled “Connect to Cased”](#connect-to-cased)
1. Go to [app.cased.com/connections/render](https://app.cased.com/connections/render)
2. Enter your Render API key
3. Cased agent will start using the Render connection
## Agent Triggers
[Section titled “Agent Triggers”](#agent-triggers)
Cased can automatically trigger agents when Render events occur. This enables automated responses for:
* Deployment failures and build errors
* Service outages and health issues
* Auto-scaling events
* Service suspension and resumption
### Setting Up Webhook Triggers
[Section titled “Setting Up Webhook Triggers”](#setting-up-webhook-triggers)
1. **Get your Cased webhook URL**:
* Go to [app.cased.com/connections/render](https://app.cased.com/connections/render)
* After connecting, your webhook URL will be displayed
* The URL format is: `https://app.cased.com/webhooks//render/`
2. **Configure Render to send webhooks**:
* In Render Dashboard, go to Account Settings → Integrations → Webhooks
* Click “Add Webhook”
* Enter a name (e.g., `Cased`)
* Paste your webhook URL from Cased
* Select the events you want to trigger agents (see supported events below)
* Click Save
3. **Create an agent in Cased**:
* Go to [app.cased.com/agents](https://app.cased.com/agents)
* Click “Create Agent”
* Under triggers, select “Render” and choose the events to respond to
* Configure your agent instructions
### Supported Events
[Section titled “Supported Events”](#supported-events)
| Category | Events |
| ------------------ | --------------------------------------------------------------------------- |
| **Deploy** | `deploy:started`, `deploy:ended`, `build:started`, `build:ended` |
| **Service Health** | `server:failed`, `server:available`, `service:suspended`, `service:resumed` |
| **Scaling** | `autoscaling:started`, `autoscaling:ended`, `instance:scaled` |
### Event Context
[Section titled “Event Context”](#event-context)
When a Render event triggers an agent, Cased provides the following context variables:
| Variable | Description |
| ------------------------- | --------------------------------------------------------- |
| `event_type` | The type of event (e.g., `deploy_ended`, `server_failed`) |
| `service_id` | The Render service ID |
| `service_name` | The service name |
| `status` | Event status (e.g., `succeeded`, `failed`, `canceled`) |
| `deploy_id` | Deployment ID (for deploy events) |
| `commit_id` | Git commit ID (for deploy events) |
| `commit_message` | Git commit message (for deploy events) |
| `instance_count` | Current instance count (for scaling events) |
| `previous_instance_count` | Previous instance count (for scaling events) |
| `timestamp` | When the event occurred |
## Metrics
[Section titled “Metrics”](#metrics)
Cased can query detailed metrics from your Render services:
| Metric Type | Description |
| -------------------- | ----------------------------------------- |
| `cpu` | CPU usage percentage |
| `memory` | Memory usage in bytes |
| `http_requests` | Request count by status code |
| `http_latency` | Response time percentiles (p50, p95, p99) |
| `bandwidth` | Network bandwidth usage |
| `disk_usage` | Disk space used (databases) |
| `disk_capacity` | Total disk capacity (databases) |
| `active_connections` | Database connection count |
| `replication_lag` | Replica lag in seconds (databases) |
| `instance_count` | Number of running instances |
## Example Agents
[Section titled “Example Agents”](#example-agents)
### Deploy Failure Analysis
[Section titled “Deploy Failure Analysis”](#deploy-failure-analysis)
Create an agent that automatically investigates failed deployments:
```plaintext
When a deploy fails on Render:
1. Get the deployment logs
2. Analyze the build output for errors
3. Check recent commits for potential issues
4. Post findings to Slack with remediation suggestions
```
### Auto-Scaling Monitor
[Section titled “Auto-Scaling Monitor”](#auto-scaling-monitor)
Monitor scaling events and ensure services scale appropriately:
```plaintext
When auto-scaling occurs on Render:
1. Check current CPU and memory metrics
2. Compare against historical patterns
3. Alert if scaling seems unusual
4. Log scaling event for capacity planning
```
### Service Health Response
[Section titled “Service Health Response”](#service-health-response)
Respond to service outages automatically:
```plaintext
When a server fails on Render:
1. Check service logs for errors
2. Verify database connectivity
3. Check recent deployments
4. Attempt service restart if appropriate
5. Notify on-call team via Slack
```
# Sentry
> Connect Cased to Sentry to automatically analyze and resolve errors with intelligent agents
Connect Cased to Sentry to automatically analyze and resolve errors with intelligent agents
Install the public “cased” integration from your Sentry organization settings → Integrations, or visit [sentry.io/sentry-apps/cased/external-install](https://sentry.io/sentry-apps/cased/external-install/) to install directly.
## What you get
[Section titled “What you get”](#what-you-get)
When Sentry creates a new error, Cased automatically analyzes it and creates a Pull Request with a fix using the [Sentry Error Analyzer agent](/agents/default-agents).
## Setup
[Section titled “Setup”](#setup)
1. Install the Cased integration from Sentry (grants read access to issues, events, organizations, and projects)
2. Enable the “Sentry Error Analyzer” agent in your Cased organization settings
3. New errors trigger automatic analysis and PR creation
[Learn more about the Sentry Error Analyzer agent →](/agents/default-agents)
## Source Maps
[Section titled “Source Maps”](#source-maps)
For JavaScript errors, upload source maps to see original source locations instead of minified code. Works with both Sentry and [Cased Telemetry](/telemetry/overview).
```bash
uv tool install cased-cli
cased sourcemaps upload -p my-project -r v1.2.3 dist/*.map
```
[Full source maps documentation →](/telemetry/source-maps)
# Slack
> Connect Cased to Slack to manage deploys and receive notifications
Connect Cased to Slack to manage deploys and receive notifications
# Terraform Cloud
> Connect Cased to Terraform Cloud to manage your infrastructure as code
Connect Cased to Terraform Cloud to manage your infrastructure as code
# Terraform Cloud
[Section titled “Terraform Cloud”](#terraform-cloud)
To connect to Terraform Cloud, you will need your workspace name, organization ID, and an API token.
## Obtain Workspace Name and Organization ID
[Section titled “Obtain Workspace Name and Organization ID”](#obtain-workspace-name-and-organization-id)
1. Log in to your [Terraform Cloud](https://app.terraform.io) account
2. Your organization ID is displayed in the URL when you’re viewing your organization (e.g., `https://app.terraform.io/app/organizations/your-org-name`)
3. Navigate to the workspace you want to connect
4. Your workspace name is displayed at the top of the workspace page
## Generate an API Token
[Section titled “Generate an API Token”](#generate-an-api-token)
1. Go to [User Settings](https://app.terraform.io/app/settings/tokens)
2. Click “Create an API token”
3. Give your token a name (e.g., “Cased Integration”)
4. Click “Create an API token”
5. Copy the generated API token immediately, as it will only be shown once
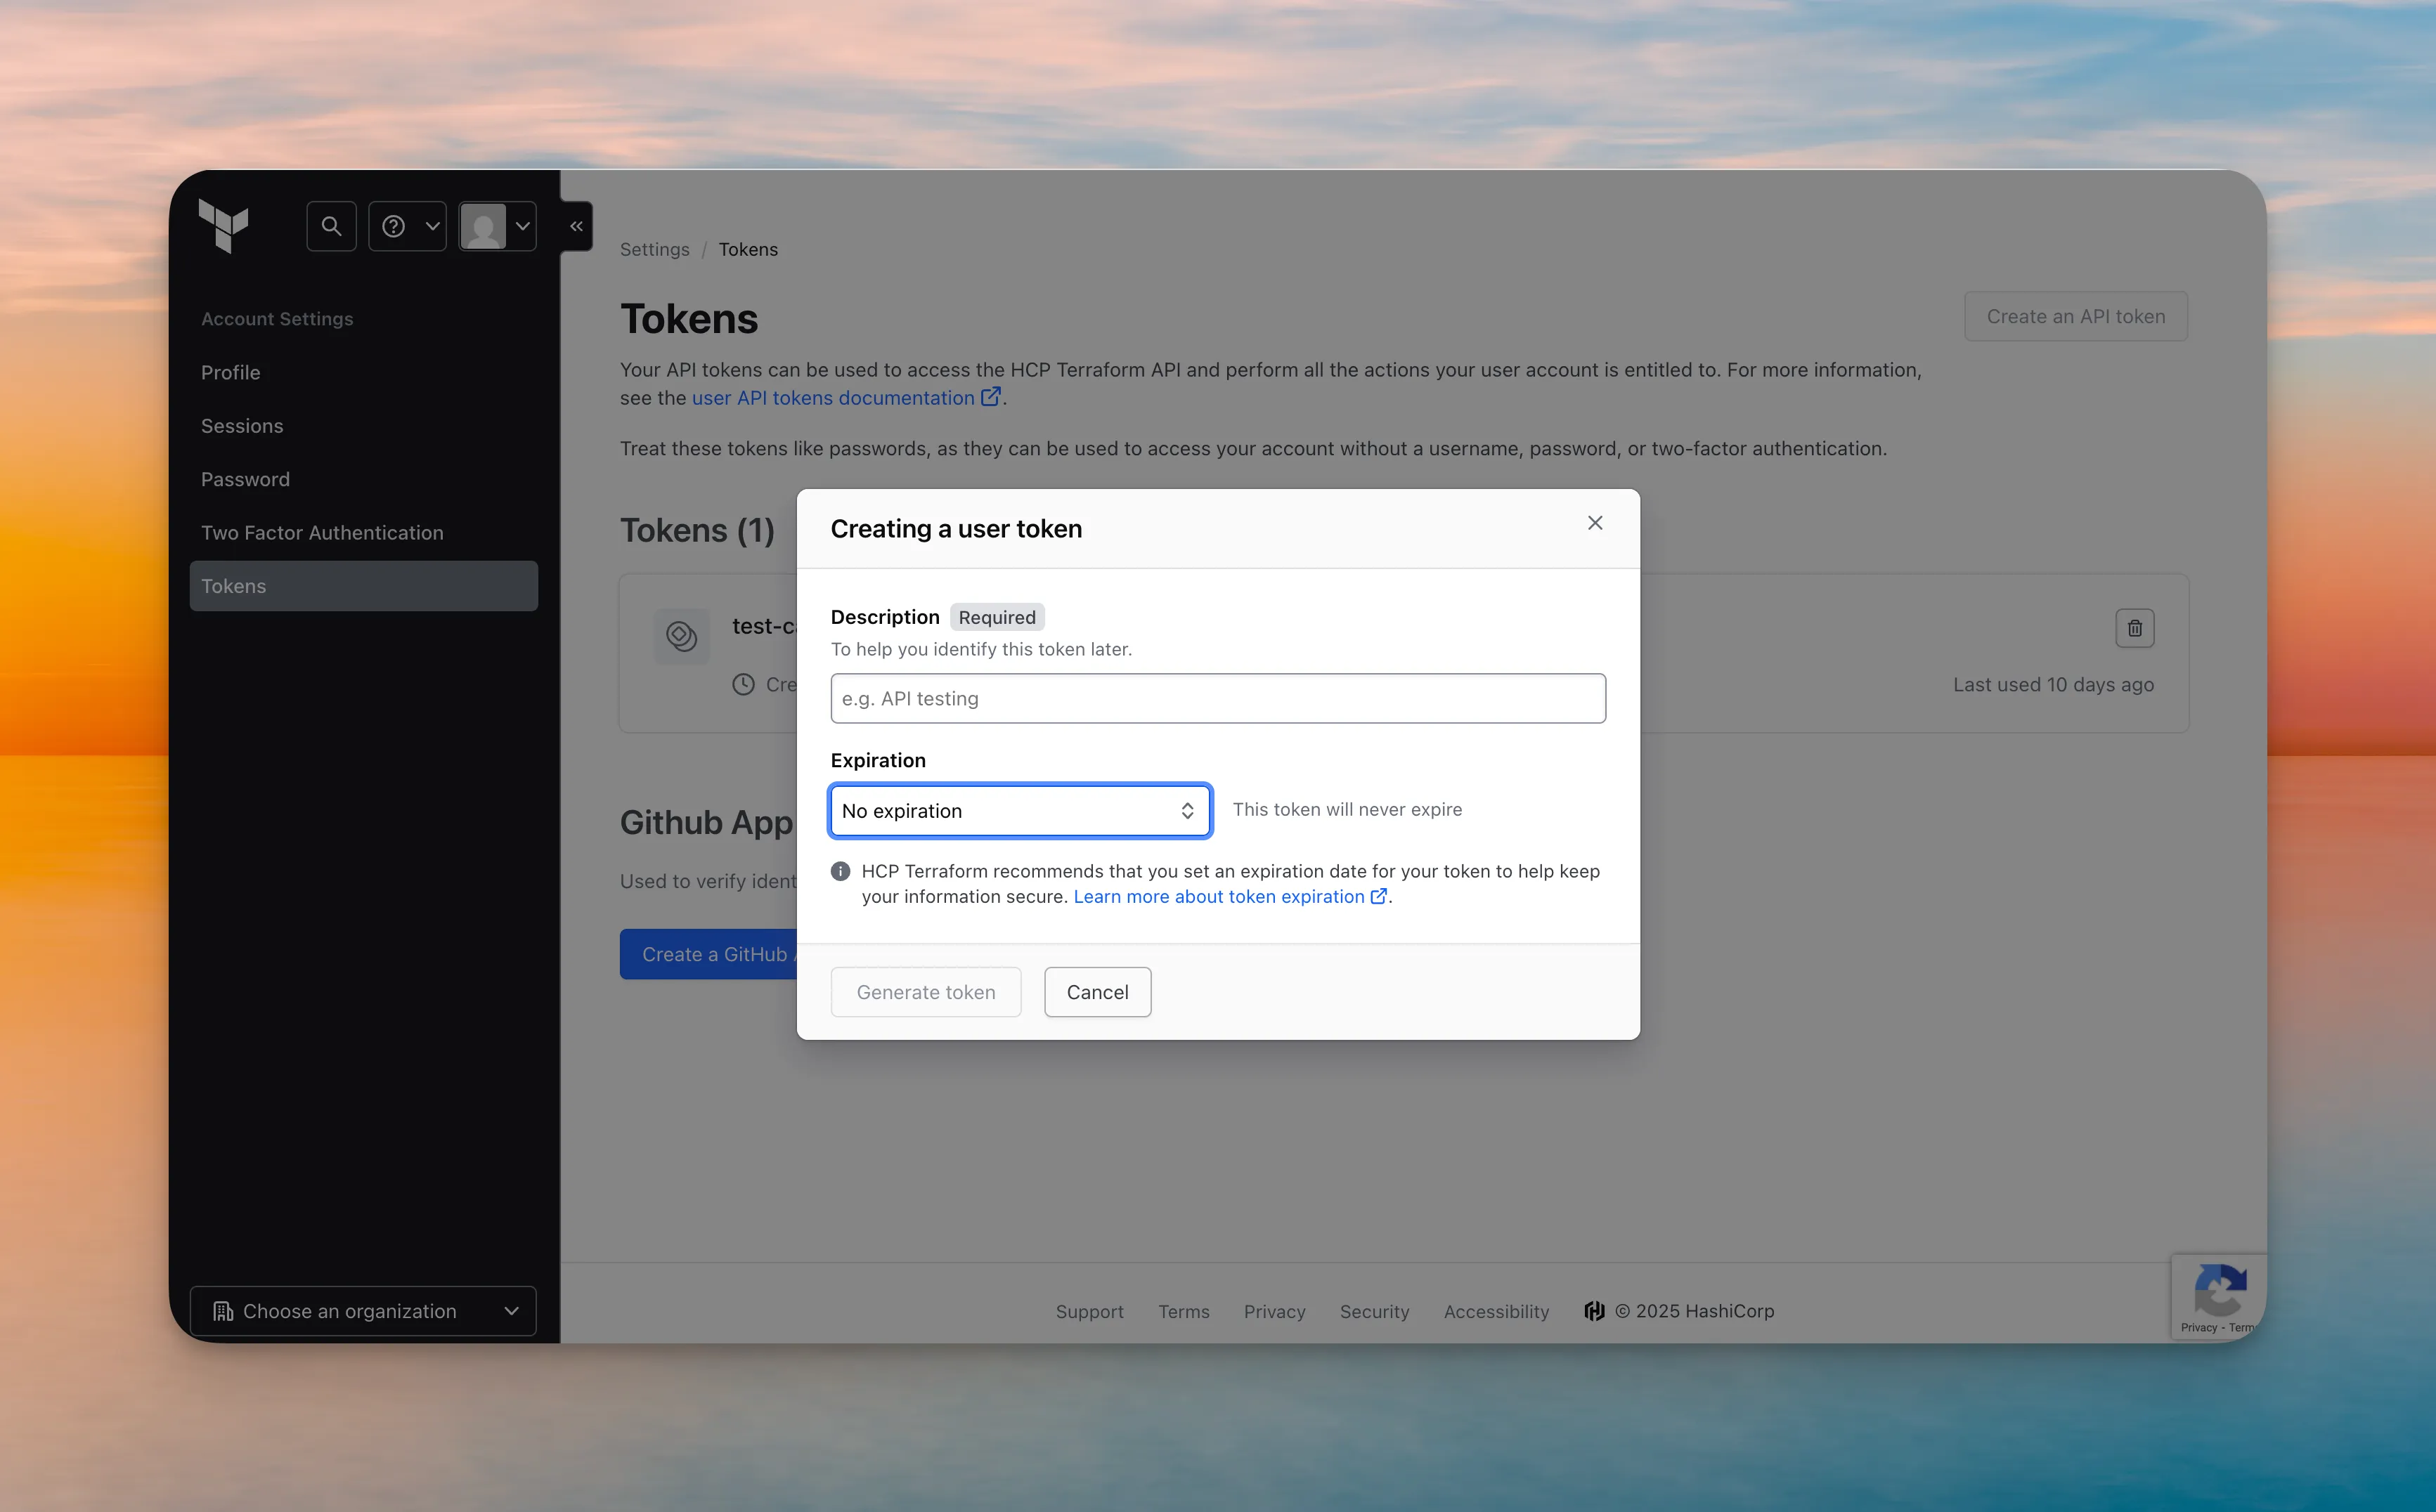
## Connect to Cased
[Section titled “Connect to Cased”](#connect-to-cased)
1. Go to [app.cased.com/connections/terraform-cloud](https://app.cased.com/connections/terraform-cloud)
2. Enter the following information:
* Workspace Name
* Organization ID
* API Token
3. Cased agent will start using the Terraform Cloud connection.
# Vercel
> Connect Cased to Vercel to monitor deployments and manage your applications
Connect Cased to Vercel to monitor deployments and manage your applications
# Vercel
[Section titled “Vercel”](#vercel)
Vercel is a platform for frontend frameworks and static sites, built to integrate with your headless content, commerce, or database. Cased integrates with Vercel to help you monitor deployments and track application performance.
## Available Actions
[Section titled “Available Actions”](#available-actions)
With Vercel connected, Cased agents can:
* **Deployment Monitoring**: List deployments and track their status
* **Application Management**: Monitor deployment states and types
* **Git Integration**: Track GitHub commits and references in deployments
* **Team Management**: Access team-specific deployment information
* **Connection Testing**: Verify Vercel connection status
## Setup
[Section titled “Setup”](#setup)
To connect Vercel to Cased:
1. Visit
2. Create a new API token with appropriate permissions
3. If you’re part of a team, note your team ID from the Vercel dashboard
## Connect to Cased
[Section titled “Connect to Cased”](#connect-to-cased)
1. Go to [app.cased.com/connections/vercel](https://app.cased.com/connections/vercel)
2. Enter your Vercel API token
3. Enter your team ID (if applicable)
4. Cased agent will start using the Vercel connection
## Common Use Cases
[Section titled “Common Use Cases”](#common-use-cases)
* **Deployment Monitoring**: Track deployment status and identify failed deployments
* **Performance Analysis**: Monitor deployment frequency and success rates
* **Git Integration**: Correlate deployments with specific commits and branches
* **Team Collaboration**: Monitor team-wide deployment activity
# Mission Control Overview
> Mission Control: Your command center for agents. Real-time Kanban view of all organizational activity.
Mission Control: Your command center for agents. Real-time Kanban view of all organizational activity.
Mission Control gives you clear, actionable visibility into engineering operations. See what agents work on. Review findings. Take action.
## The Board
[Section titled “The Board”](#the-board)
The Kanban board drives Mission Control. Each card represents a sub-agent created by your agents. Cards organize by status: To Do, In Progress, Done.
Drag cards to change status. Click cards for sub-agent details, conversation history, and produced artifacts.
## Automated Sub-agent Creation
[Section titled “Automated Sub-agent Creation”](#automated-sub-agent-creation)
Cased creates sub-agents automatically through periodic infrastructure scans. Background scans analyze your infrastructure for:
* **Infrastructure Drift**: Running infrastructure mismatches infrastructure-as-code
* **Security Vulnerabilities**: Configurations that expose security risks
* **Best Practice Violations**: Infrastructure that violates recommendations
Scans detecting issues create sub-agents automatically with full details. See problems immediately. Fix them quickly.
# Security Overview
> Learn about Cased's security practices, compliance certifications, and deployment protection measures
Learn about Cased's security practices, compliance certifications, and deployment protection measures
## Compliance Certifications
[Section titled “Compliance Certifications”](#compliance-certifications)
### SOC 2 Compliance
[Section titled “SOC 2 Compliance”](#soc-2-compliance)
Cased is committed to maintaining the highest security standards:
* **SOC 2 Type I**: Completed
* **SOC 2 Type II**: In progress
Our SOC 2 compliance demonstrates our commitment to:
* Security
* Availability
* Process Integrity
* Confidentiality
* Privacy
SOC 2 reports are available to customers under NDA.
## Security Features
[Section titled “Security Features”](#security-features)
### Authentication & Access Control
[Section titled “Authentication & Access Control”](#authentication--access-control)
* Google Workspace SSO integration
* Fine-grained access controls
* API token management
* Session security
### Deployment Security
[Section titled “Deployment Security”](#deployment-security)
* Required approvals for sensitive environments
* Branch protection rules
* Deployment queues
* Automated rollbacks
* Health monitoring
### Infrastructure Security
[Section titled “Infrastructure Security”](#infrastructure-security)
* All data encrypted at rest and in transit
* Regular security updates
* Infrastructure as code
* Automated security scanning
### Monitoring & Auditing
[Section titled “Monitoring & Auditing”](#monitoring--auditing)
* Comprehensive audit logs
* Deployment tracking
* Access monitoring
* Real-time alerts
## Security Best Practices
[Section titled “Security Best Practices”](#security-best-practices)
### Access Management
[Section titled “Access Management”](#access-management)
1. **Principle of Least Privilege**
* Grant minimal required permissions
* Regular access reviews
* Automated access revocation
2. **Authentication**
* Use Google Workspace SSO
* Rotate API tokens regularly
* Monitor authentication attempts
3. **Deployment Safety**
* Configure approval requirements
* Set up branch protection
* Enable automated rollbacks
* Monitor deployment health
### Audit & Compliance
[Section titled “Audit & Compliance”](#audit--compliance)
1. **Audit Logs**
* All actions are logged
* Immutable audit trail
* Searchable history
* Export capabilities
2. **Compliance Controls**
* Access reviews
* Change management
* Incident response
* Risk assessments
## Data Protection
[Section titled “Data Protection”](#data-protection)
### Data Security
[Section titled “Data Security”](#data-security)
* All data encrypted at rest using AES-256
* TLS 1.2+ required for all connections
* Regular security assessments
* Automated vulnerability scanning
### Data Privacy
[Section titled “Data Privacy”](#data-privacy)
* Data minimization practices
* Privacy by design
* GDPR compliance
* Data retention policies
## Security Reporting
[Section titled “Security Reporting”](#security-reporting)
### Vulnerability Reporting
[Section titled “Vulnerability Reporting”](#vulnerability-reporting)
If you discover a security vulnerability, please report it to:
* Email:
* Response time: Within 24 hours
* Bounty program available for qualifying reports
### Incident Response
[Section titled “Incident Response”](#incident-response)
1. **24/7 Monitoring**
* Real-time threat detection
* Automated alerts
* Incident tracking
2. **Response Process**
* Immediate triage
* Customer notification
* Root cause analysis
* Remediation tracking
## Enterprise Security Features
[Section titled “Enterprise Security Features”](#enterprise-security-features)
### Single Sign-On (SSO)
[Section titled “Single Sign-On (SSO)”](#single-sign-on-sso)
* Google Workspace integration
* SAML 2.0 support
* Just-in-time provisioning
* Group sync
### Audit & Compliance
[Section titled “Audit & Compliance”](#audit--compliance-1)
* Detailed audit logs
* Compliance reporting
* Custom retention policies
* Export capabilities
### Advanced Security Controls
[Section titled “Advanced Security Controls”](#advanced-security-controls)
* IP allowlisting
* Session management
* API access controls
* Custom security policies
# Team Management
> Invite teammates and manage your organization's users in Cased.
Invite teammates and manage your organization's users in Cased.
Cased allows you to invite teammates to collaborate on infrastructure management, deployments, and workflows within your organization.
## Inviting teammates
[Section titled “Inviting teammates”](#inviting-teammates)
You can invite new users to your organization from the **Settings** page:
1. Navigate to **Settings** in the left sidebar
2. Enter your teammate’s email address
3. Click **Invite User**
The invited user will receive an email with instructions to join your organization.
### During onboarding
[Section titled “During onboarding”](#during-onboarding)
When you first create an organization, the onboarding wizard will prompt you to invite teammates. This is a convenient way to get your team set up quickly.
## How invites work
[Section titled “How invites work”](#how-invites-work)
When you invite a user:
1. **Same domain users** (e.g., inviting `teammate@yourcompany.com` to an org with domain `yourcompany.com`):
* An invite email is sent
* When the user signs in with SSO (Google Workspace, GitHub, etc.), they are automatically added to your organization
2. **External users** (e.g., contractors with different email domains):
* A Cased account is created for them
* They receive an email with a password reset link
* They are immediately added to your organization
## Auto-enrollment settings
[Section titled “Auto-enrollment settings”](#auto-enrollment-settings)
Organization admins can configure whether users with matching email domains are automatically added to the organization when they sign up.
### Enabling auto-enrollment
[Section titled “Enabling auto-enrollment”](#enabling-auto-enrollment)
When **Auto-enroll domain users** is enabled:
* Any user who signs in with SSO using an email from your organization’s domain will automatically join your organization
* No explicit invite is required
### Disabling auto-enrollment (default)
[Section titled “Disabling auto-enrollment (default)”](#disabling-auto-enrollment-default)
When **Auto-enroll domain users** is disabled:
* Users must be explicitly invited to join your organization
* This provides more control over who can access your organization’s resources
* Invited users will still be automatically added when they sign up via SSO
To change this setting:
1. Go to **Settings**
2. Find the **Auto-enroll domain users** toggle
3. Enable or disable as needed
## User roles
[Section titled “User roles”](#user-roles)
Cased supports two user roles:
| Role | Permissions |
| ---------- | ----------------------------------------------------------------------------------- |
| **Member** | View and interact with agents, workflows, and integrations |
| **Admin** | All member permissions, plus: invite users, manage settings, configure integrations |
### Changing user roles
[Section titled “Changing user roles”](#changing-user-roles)
Admins can promote members to admins or demote admins to members:
1. Go to **Settings**
2. Find the user in the team member list
3. Click the menu icon next to their name
4. Select **Make Admin** or **Remove Admin**
## Removing users
[Section titled “Removing users”](#removing-users)
To remove a user from your organization:
1. Go to **Settings**
2. Find the user in the team member list
3. Click the menu icon next to their name
4. Select **Remove from organization**
Note
Removing a user does not delete their Cased account. They can still create or join other organizations.
# Telemetry API
> API reference for querying and ingesting telemetry data
API reference for querying and ingesting telemetry data
The Telemetry API allows you to query errors, metrics, and traces collected by Cased. All endpoints require authentication with an API key.
## Authentication
[Section titled “Authentication”](#authentication)
Include your API key in the `Authorization` header:
```plaintext
Authorization: Bearer YOUR_API_KEY
```
***
## Projects
[Section titled “Projects”](#projects)
### List Projects
[Section titled “List Projects”](#list-projects)
Returns all telemetry projects for your organization.
**`GET /api/v1/telemetry/projects/`**
#### Example Request
[Section titled “Example Request”](#example-request)
```bash
curl -X GET https://app.cased.com/api/v1/telemetry/projects/ \
-H "Authorization: Bearer YOUR_API_KEY"
```
#### Example Response
[Section titled “Example Response”](#example-response)
```json
{
"projects": [
{
"id": "2qNyVcXdPmE8K4L6R9T1W3Y5",
"name": "production-api",
"dsn": "https://abc123@telemetry.cased.com/1",
"is_active": true,
"created_at": "2025-01-10T10:00:00Z"
}
]
}
```
### Create Project
[Section titled “Create Project”](#create-project)
Creates a new telemetry project and returns a DSN for the Sentry SDK.
**`POST /api/v1/telemetry/projects/`**
#### Body
[Section titled “Body”](#body)
| Field | Type | Description |
| ------ | ------ | --------------------------------------------------- |
| `name` | string | **Required.** Project name (e.g., “production-api”) |
#### Example Request
[Section titled “Example Request”](#example-request-1)
```bash
curl -X POST https://app.cased.com/api/v1/telemetry/projects/ \
-H "Authorization: Bearer YOUR_API_KEY" \
-H "Content-Type: application/json" \
-d '{"name": "my-service"}'
```
#### Example Response
[Section titled “Example Response”](#example-response-1)
```json
{
"id": "2qNyVcXdPmE8K4L6R9T1W3Y5",
"name": "my-service",
"dsn": "https://abc123def456@telemetry.cased.com/1",
"is_active": true,
"created_at": "2025-01-10T10:00:00Z"
}
```
***
## Query Errors
[Section titled “Query Errors”](#query-errors)
### List Errors
[Section titled “List Errors”](#list-errors)
Returns error events with optional filtering.
**`GET /api/v1/telemetry/query/errors/`**
#### Query Parameters
[Section titled “Query Parameters”](#query-parameters)
| Parameter | Type | Default | Description |
| ------------ | ------- | ------- | ------------------------------------------- |
| `since` | string | `24h` | Time range: `1h`, `6h`, `24h`, `7d`, `30d` |
| `project_id` | string | - | Filter by telemetry project |
| `level` | string | - | Filter by level: `error`, `warning`, `info` |
| `search` | string | - | Search in error message |
| `limit` | integer | 100 | Max results (1-1000) |
| `offset` | integer | 0 | Pagination offset |
#### Example Request
[Section titled “Example Request”](#example-request-2)
```bash
curl -X GET "https://app.cased.com/api/v1/telemetry/query/errors/?since=24h&level=error&limit=10" \
-H "Authorization: Bearer YOUR_API_KEY"
```
#### Example Response
[Section titled “Example Response”](#example-response-2)
```json
{
"events": [
{
"event_id": "abc123",
"timestamp": "2025-01-10T15:30:00Z",
"level": "error",
"message": "Connection timeout",
"exception_type": "TimeoutError",
"exception_value": "Connection to database timed out after 30s",
"platform": "python",
"sdk_name": "sentry.python",
"tags": {
"environment": "production",
"service": "api"
},
"stack_trace": "Traceback (most recent call last):\n File \"app.py\", line 42..."
}
],
"total": 156,
"has_more": true
}
```
***
## Query Metrics
[Section titled “Query Metrics”](#query-metrics)
### Get Container Metrics
[Section titled “Get Container Metrics”](#get-container-metrics)
Returns container metrics from cased-agent.
**`GET /api/v1/telemetry/query/metrics/`**
#### Query Parameters
[Section titled “Query Parameters”](#query-parameters-1)
| Parameter | Type | Default | Description |
| ----------- | ------ | ------- | ------------------------------------------ |
| `since` | string | `1h` | Time range: `5m`, `15m`, `1h`, `6h`, `24h` |
| `cluster` | string | - | Filter by cluster ID |
| `namespace` | string | - | Filter by Kubernetes namespace |
| `pod` | string | - | Filter by pod name (prefix match) |
| `container` | string | - | Filter by container name |
| `metric` | string | - | Filter by metric name |
#### Example Request
[Section titled “Example Request”](#example-request-3)
```bash
curl -X GET "https://app.cased.com/api/v1/telemetry/query/metrics/?since=1h&namespace=production&metric=cpu_usage_cores" \
-H "Authorization: Bearer YOUR_API_KEY"
```
#### Example Response
[Section titled “Example Response”](#example-response-3)
```json
{
"metrics": [
{
"timestamp": "2025-01-10T15:30:00Z",
"cluster": "prod",
"namespace": "production",
"pod": "api-server-abc123",
"container": "api",
"metric_name": "cpu_usage_cores",
"value": 0.45
}
],
"total": 1250
}
```
***
## Query Traces
[Section titled “Query Traces”](#query-traces)
### List Traces
[Section titled “List Traces”](#list-traces)
Returns distributed traces and spans.
**`GET /api/v1/telemetry/query/traces/`**
#### Query Parameters
[Section titled “Query Parameters”](#query-parameters-2)
| Parameter | Type | Default | Description |
| ----------------- | ------- | ------- | --------------------------- |
| `since` | string | `1h` | Time range |
| `project_id` | string | - | Filter by telemetry project |
| `service` | string | - | Filter by service name |
| `operation` | string | - | Filter by operation name |
| `min_duration_ms` | integer | - | Filter by minimum duration |
| `limit` | integer | 100 | Max results |
#### Example Request
[Section titled “Example Request”](#example-request-4)
```bash
curl -X GET "https://app.cased.com/api/v1/telemetry/query/traces/?since=1h&service=api&min_duration_ms=1000" \
-H "Authorization: Bearer YOUR_API_KEY"
```
#### Example Response
[Section titled “Example Response”](#example-response-4)
```json
{
"traces": [
{
"trace_id": "abc123def456",
"root_span": {
"span_id": "span123",
"service": "api",
"operation": "POST /users",
"duration_ms": 1250,
"status": "ok",
"timestamp": "2025-01-10T15:30:00Z"
},
"span_count": 5,
"services": ["api", "database", "cache"]
}
],
"total": 42
}
```
***
## Query Stats
[Section titled “Query Stats”](#query-stats)
### Get Telemetry Statistics
[Section titled “Get Telemetry Statistics”](#get-telemetry-statistics)
Returns aggregate statistics for telemetry data.
**`GET /api/v1/telemetry/query/stats/`**
#### Query Parameters
[Section titled “Query Parameters”](#query-parameters-3)
| Parameter | Type | Default | Description |
| ------------ | ------ | ------- | ----------------- |
| `since` | string | `24h` | Time range |
| `project_id` | string | - | Filter by project |
#### Example Request
[Section titled “Example Request”](#example-request-5)
```bash
curl -X GET "https://app.cased.com/api/v1/telemetry/query/stats/?since=24h" \
-H "Authorization: Bearer YOUR_API_KEY"
```
#### Example Response
[Section titled “Example Response”](#example-response-5)
```json
{
"stats": {
"events": {
"total": 15234,
"errors": 342,
"warnings": 1205,
"info": 13687
},
"metrics": {
"total": 125000,
"containers": 45,
"pods": 23
},
"traces": {
"total": 8500,
"avg_duration_ms": 145
}
},
"period": {
"start": "2025-01-09T15:30:00Z",
"end": "2025-01-10T15:30:00Z"
}
}
```
***
## Ingestion Endpoints
[Section titled “Ingestion Endpoints”](#ingestion-endpoints)
These endpoints are typically used by SDKs, not called directly.
### Ingest Errors (Sentry SDK)
[Section titled “Ingest Errors (Sentry SDK)”](#ingest-errors-sentry-sdk)
**`POST /api//envelope/`**
Used by the Sentry SDK. Configure your DSN and the SDK handles this automatically.
### Ingest Metrics (cased-agent)
[Section titled “Ingest Metrics (cased-agent)”](#ingest-metrics-cased-agent)
**`POST /api/v1/telemetry/metrics`**
Used by cased-agent to send container metrics.
#### Headers
[Section titled “Headers”](#headers)
| Header | Description |
| --------------- | --------------------- |
| `Authorization` | `Bearer YOUR_API_KEY` |
| `Content-Type` | `application/json` |
#### Body
[Section titled “Body”](#body-1)
```json
{
"metrics": [
{
"timestamp": "2025-01-10T15:30:00Z",
"cluster": "prod",
"namespace": "production",
"pod": "api-server-abc123",
"container": "api",
"node": "ip-10-0-1-100",
"metrics": {
"cpu_usage_cores": 0.45,
"memory_usage_bytes": 536870912,
"network_rx_bytes": 1048576,
"network_tx_bytes": 524288
}
}
]
}
```
### Ingest Spans
[Section titled “Ingest Spans”](#ingest-spans)
**`POST /api/v1/telemetry/spans`**
Used to ingest distributed tracing spans.
#### Body
[Section titled “Body”](#body-2)
```json
{
"spans": [
{
"trace_id": "abc123def456",
"span_id": "span123",
"parent_span_id": null,
"service": "api",
"operation": "POST /users",
"start_time": "2025-01-10T15:30:00Z",
"duration_ms": 125,
"status": "ok",
"attributes": {
"http.method": "POST",
"http.url": "/users"
}
}
]
}
```
***
## Cluster Aggregation
[Section titled “Cluster Aggregation”](#cluster-aggregation)
These endpoints provide cluster-wide views of your infrastructure, aggregating metrics across all nodes and pods.
### Get Cluster Overview
[Section titled “Get Cluster Overview”](#get-cluster-overview)
Returns a high-level summary of cluster health including CPU, memory, pod counts, and active issues.
**`GET /api/v1/telemetry/query/cluster/overview/`**
#### Query Parameters
[Section titled “Query Parameters”](#query-parameters-4)
| Parameter | Type | Default | Description |
| ------------ | ------- | ------- | ------------------------- |
| `hours_back` | integer | `1` | Hours to look back (1-24) |
#### Example Request
[Section titled “Example Request”](#example-request-6)
```bash
curl -X GET "https://app.cased.com/api/v1/telemetry/query/cluster/overview/?hours_back=1" \
-H "Authorization: Bearer YOUR_API_KEY"
```
#### Example Response
[Section titled “Example Response”](#example-response-6)
```json
{
"hours_back": 1,
"cluster": {
"node_count": 5,
"total_pods": 42,
"cpu_used_percent": 35.2,
"memory_used_percent": 58.4,
"memory_total_gb": 80.0,
"memory_used_gb": 46.7
},
"nodes": {
"ip-10-0-1-100": {
"cpu_used_percent": 42.1,
"memory_used_percent": 65.3
}
},
"pods_by_namespace": {
"production": 25,
"staging": 12,
"kube-system": 5
},
"issues": {
"crashloops": 0,
"warnings": 3,
"total": 3
},
"http": {
"error_rate": 0.5,
"latency_p95": 145.2,
"request_count": 15234
}
}
```
### Get Node Comparison
[Section titled “Get Node Comparison”](#get-node-comparison)
Compares metrics across all nodes to identify imbalances or hot spots.
**`GET /api/v1/telemetry/query/cluster/nodes/`**
#### Query Parameters
[Section titled “Query Parameters”](#query-parameters-5)
| Parameter | Type | Default | Description |
| ------------ | ------- | ------- | ------------------------- |
| `hours_back` | integer | `1` | Hours to look back (1-24) |
#### Example Request
[Section titled “Example Request”](#example-request-7)
```bash
curl -X GET "https://app.cased.com/api/v1/telemetry/query/cluster/nodes/?hours_back=1" \
-H "Authorization: Bearer YOUR_API_KEY"
```
#### Example Response
[Section titled “Example Response”](#example-response-7)
```json
{
"hours_back": 1,
"node_count": 5,
"nodes": {
"ip-10-0-1-100": {
"cpu_used_percent": {"avg": 42.1, "min": 30.5, "max": 65.2},
"memory_used_percent": {"avg": 65.3, "min": 60.1, "max": 72.0},
"memory_total_gb": 16.0,
"pod_count": 12
}
},
"rankings": {
"by_cpu_usage": ["ip-10-0-1-100", "ip-10-0-1-101", "ip-10-0-1-102"],
"by_memory_usage": ["ip-10-0-1-101", "ip-10-0-1-100", "ip-10-0-1-102"]
},
"hottest_node": "ip-10-0-1-100"
}
```
### Get Top Resource Consumers
[Section titled “Get Top Resource Consumers”](#get-top-resource-consumers)
Identifies the pods consuming the most CPU or memory across the cluster.
**`GET /api/v1/telemetry/query/cluster/top/`**
#### Query Parameters
[Section titled “Query Parameters”](#query-parameters-6)
| Parameter | Type | Default | Description |
| ------------ | ------- | ------- | -------------------------------- |
| `resource` | string | `cpu` | Resource type: `cpu` or `memory` |
| `hours_back` | integer | `1` | Hours to look back (1-24) |
| `limit` | integer | `10` | Number of results (1-50) |
#### Example Request
[Section titled “Example Request”](#example-request-8)
```bash
curl -X GET "https://app.cased.com/api/v1/telemetry/query/cluster/top/?resource=cpu&limit=5" \
-H "Authorization: Bearer YOUR_API_KEY"
```
#### Example Response
[Section titled “Example Response”](#example-response-8)
```json
{
"resource": "cpu",
"hours_back": 1,
"limit": 5,
"top_consumers": [
{
"namespace": "production",
"pod": "api-server-abc123",
"avg_percent": 85.2,
"max_percent": 98.1
},
{
"namespace": "production",
"pod": "worker-xyz789",
"avg_percent": 72.1,
"max_percent": 89.5
}
],
"by_namespace": {
"production": {"avg": 45.2, "pod_count": 25},
"staging": {"avg": 22.1, "pod_count": 12}
}
}
```
***
## Rate Limits
[Section titled “Rate Limits”](#rate-limits)
| Endpoint | Limit |
| ------------------- | -------------------- |
| Query endpoints | 100 requests/minute |
| Ingestion endpoints | 1000 requests/minute |
Rate limit headers are included in responses:
* `X-RateLimit-Limit`: Request limit
* `X-RateLimit-Remaining`: Remaining requests
* `X-RateLimit-Reset`: Reset timestamp
# Metrics
> Collect container metrics from Kubernetes with cased-agent
Collect container metrics from Kubernetes with cased-agent
Cased Telemetry collects infrastructure metrics from your Kubernetes cluster using **cased-agent**, a lightweight DaemonSet that captures container CPU, memory, network, and events.
## Features
[Section titled “Features”](#features)
* **Container Metrics** - CPU, memory, network I/O for every container
* **Kubernetes Events** - Pod restarts, OOM kills, scheduling events
* **Node Metrics** - Host-level CPU and memory utilization
* **eBPF HTTP Tracing** - Kernel-level HTTP request/response capture without application changes
* **Low Overhead** - Minimal resource usage (10m CPU, 64Mi memory)
## Prerequisites
[Section titled “Prerequisites”](#prerequisites)
* Kubernetes 1.21+
* kubectl configured with cluster access
* Cased API key (from organization settings)
## Installation
[Section titled “Installation”](#installation)
### Helm (Recommended)
[Section titled “Helm (Recommended)”](#helm-recommended)
```bash
helm install cased-agent oci://ghcr.io/cased/charts/cased-agent \
--namespace cased-system \
--create-namespace \
--set apiKey=YOUR_CASED_API_KEY \
--set clusterId=prod
```
### kubectl
[Section titled “kubectl”](#kubectl)
For a simpler installation without Helm:
```bash
# Apply the manifest (creates namespace and RBAC)
kubectl apply -f https://raw.githubusercontent.com/cased/cased-agent/main/deploy/manifests/install.yaml
# Create the API key secret
kubectl -n cased-system create secret generic cased-agent \
--from-literal=api-key="YOUR_CASED_API_KEY"
# Set your cluster ID
kubectl -n cased-system set env daemonset/cased-agent CASED_CLUSTER_ID=prod
```
### 3. Verify deployment
[Section titled “3. Verify deployment”](#3-verify-deployment)
```bash
# Check DaemonSet status
kubectl -n cased-system get daemonset cased-agent
# View agent logs
kubectl -n cased-system logs -l app=cased-agent --tail=50
```
## Configuration
[Section titled “Configuration”](#configuration)
### Environment Variables
[Section titled “Environment Variables”](#environment-variables)
| Variable | Required | Default | Description |
| -------------------- | -------- | ----------------------- | --------------------------------------------------- |
| `CASED_API_KEY` | Yes | - | Your organization API key |
| `CASED_API_ENDPOINT` | No | `https://app.cased.com` | Cased API endpoint |
| `CASED_CLUSTER_ID` | No | `default` | Identifier for this cluster |
| `CASED_ORG_ID` | No | - | Organization ID (auto-detected from API key) |
| `ENABLE_EBPF` | No | `true`\* | Enable eBPF HTTP tracing (requires privileged mode) |
\*Default in provided manifest. Binary defaults to `false` if not set.
### Command-line Arguments
[Section titled “Command-line Arguments”](#command-line-arguments)
| Argument | Default | Description |
| -------------- | ------- | --------------------------------- |
| `--interval` | `15s` | Metrics collection interval |
| `--batch-size` | `100` | Number of metrics per API request |
### Resource Limits
[Section titled “Resource Limits”](#resource-limits)
The default resource configuration is designed for minimal overhead:
```yaml
resources:
requests:
cpu: 10m
memory: 64Mi
limits:
cpu: 200m
memory: 256Mi
```
Adjust based on cluster size. For large clusters (100+ nodes), consider:
```yaml
resources:
requests:
cpu: 50m
memory: 128Mi
limits:
cpu: 500m
memory: 512Mi
```
## Metrics Collected
[Section titled “Metrics Collected”](#metrics-collected)
### Container Metrics
[Section titled “Container Metrics”](#container-metrics)
| Metric | Type | Description |
| ----------------------- | ------- | -------------------------- |
| `cpu_usage_cores` | gauge | Current CPU usage in cores |
| `cpu_throttled_seconds` | counter | Time CPU was throttled |
| `memory_usage_bytes` | gauge | Current memory usage |
| `memory_limit_bytes` | gauge | Memory limit from cgroup |
| `network_rx_bytes` | counter | Network bytes received |
| `network_tx_bytes` | counter | Network bytes transmitted |
### Labels
[Section titled “Labels”](#labels)
Each metric includes labels for filtering:
* `cluster` - Cluster ID from configuration
* `namespace` - Kubernetes namespace
* `pod` - Pod name
* `container` - Container name
* `node` - Node hostname
## eBPF HTTP Tracing
[Section titled “eBPF HTTP Tracing”](#ebpf-http-tracing)
The cased-agent uses eBPF (Extended Berkeley Packet Filter) to capture HTTP requests and responses at the kernel level. This provides:
* **Zero-instrumentation observability** - No code changes or sidecars required
* **Complete visibility** - Captures all HTTP traffic, including internal service-to-service calls
* **Low overhead** - eBPF runs in kernel space with minimal performance impact
* **Cross-kernel portability** - Uses CO:RE (Compile Once - Run Everywhere) for compatibility across kernel versions
### How eBPF Works
[Section titled “How eBPF Works”](#how-ebpf-works)
eBPF programs attach to kernel syscalls (`sendto`, `recvfrom`) to intercept network data. The agent parses HTTP method, path, and status code from the raw bytes, then sends this data to Cased for correlation with errors and metrics.
```plaintext
┌─────────────────────────────────────────────────────────────┐
│ Kernel Space │
│ ┌─────────────┐ ┌─────────────┐ ┌───────────────┐ │
│ │ sendto() │────>│ eBPF probe │────>│ Ring buffer │ │
│ │ recvfrom() │ │ (http_trace)│ │ │ │
│ └─────────────┘ └─────────────┘ └───────┬───────┘ │
└─────────────────────────────────────────────────┬─────────┘
│
┌─────────────────────────────────────────────────▼─────────┐
│ User Space │
│ ┌─────────────────────────────────────────────────────┐ │
│ │ cased-agent: parse HTTP, enrich with K8s labels, │ │
│ │ send to Cased API │ │
│ └─────────────────────────────────────────────────────┘ │
└───────────────────────────────────────────────────────────┘
```
### Disabling eBPF
[Section titled “Disabling eBPF”](#disabling-ebpf)
If you don’t need HTTP tracing or can’t run privileged containers, disable eBPF:
```yaml
env:
- name: ENABLE_EBPF
value: "false"
```
With eBPF disabled, the agent still collects container metrics and Kubernetes events, but won’t capture HTTP traffic.
## Security
[Section titled “Security”](#security)
The cased-agent requires elevated permissions to collect comprehensive telemetry. This section explains what’s required and why.
### With eBPF Enabled (Default)
[Section titled “With eBPF Enabled (Default)”](#with-ebpf-enabled-default)
When eBPF HTTP tracing is enabled, the agent requires privileged mode:
```yaml
securityContext:
privileged: true
capabilities:
add:
- SYS_PTRACE # Read process info from /proc
- SYS_ADMIN # Load eBPF programs into kernel
- NET_ADMIN # Attach to network syscalls
```
**Why privileged mode?**
eBPF programs run in kernel space and require `CAP_SYS_ADMIN` to load. While Kubernetes supports granular capabilities, eBPF verifier and BTF (BPF Type Format) access typically require privileged mode for reliable operation across different kernel versions and cloud providers.
This is the same approach used by other eBPF-based observability tools like Groundcover, Cilium, and Pixie.
**Additional mounts required:**
* `/sys/kernel/debug` (read-only) - Access BTF type information for CO:RE
### With eBPF Disabled
[Section titled “With eBPF Disabled”](#with-ebpf-disabled)
When eBPF is disabled, the agent requires minimal permissions:
* **hostPID: true** - Access to `/proc` for container metrics
* **SYS\_PTRACE** - Read process information from `/proc`
* **ClusterRole** - Read-only access to pods, nodes, namespaces, events
### RBAC Permissions
[Section titled “RBAC Permissions”](#rbac-permissions)
The agent’s ClusterRole has read-only access:
```yaml
rules:
- apiGroups: [""]
resources: ["pods", "nodes", "namespaces", "events"]
verbs: ["get", "list", "watch"]
- apiGroups: ["metrics.k8s.io"]
resources: ["pods", "nodes"]
verbs: ["get", "list"]
```
### Security Best Practices
[Section titled “Security Best Practices”](#security-best-practices)
1. **Dedicated namespace** - Deploy in `cased-system` to isolate from application workloads
2. **Network policies** - Restrict egress to only Cased API endpoints
3. **Image scanning** - The cased-agent image is regularly scanned for vulnerabilities
4. **Audit logging** - Enable Kubernetes audit logs to monitor privileged container activity
5. **Pod Security Standards** - If using PSS, you’ll need to exempt `cased-system` namespace from restricted policies
## Troubleshooting
[Section titled “Troubleshooting”](#troubleshooting)
### Agent not starting
[Section titled “Agent not starting”](#agent-not-starting)
Check pod status:
```bash
kubectl -n cased-system describe pod -l app=cased-agent
```
Common issues:
* Missing secret: Create the `cased-agent-config` secret
* Image pull error: Verify ECR access or use public image
### No metrics appearing
[Section titled “No metrics appearing”](#no-metrics-appearing)
1. Verify the agent is healthy:
```bash
kubectl -n cased-system logs -l app=cased-agent | grep -i error
```
2. Check API connectivity:
```bash
kubectl -n cased-system exec -it $(kubectl -n cased-system get pod -l app=cased-agent -o jsonpath='{.items[0].metadata.name}') -- wget -qO- https://app.cased.com/health
```
3. Verify API key is valid in Cased dashboard
### High resource usage
[Section titled “High resource usage”](#high-resource-usage)
If the agent uses more resources than expected:
* Increase `--interval` to collect less frequently
* Reduce `--batch-size` to send smaller payloads
* Check for network issues causing retries
### eBPF not loading
[Section titled “eBPF not loading”](#ebpf-not-loading)
If you see “eBPF HTTP tracing disabled” in logs when it should be enabled:
1. **Check privileged mode**:
```bash
kubectl -n cased-system get pod -l app=cased-agent -o jsonpath='{.items[0].spec.containers[0].securityContext.privileged}'
# Should return: true
```
2. **Verify kernel supports BTF**:
```bash
kubectl -n cased-system exec -it $(kubectl -n cased-system get pod -l app=cased-agent -o jsonpath='{.items[0].metadata.name}') -- ls /sys/kernel/btf/vmlinux
```
Most modern kernels (5.4+) include BTF. If missing, the eBPF program can’t load with CO:RE.
3. **Check debugfs is mounted**:
```bash
kubectl -n cased-system exec -it $(kubectl -n cased-system get pod -l app=cased-agent -o jsonpath='{.items[0].metadata.name}') -- ls /sys/kernel/debug
```
4. **Review agent logs for eBPF errors**:
```bash
kubectl -n cased-system logs -l app=cased-agent | grep -i ebpf
```
### eBPF permission denied
[Section titled “eBPF permission denied”](#ebpf-permission-denied)
If you see “operation not permitted” errors:
* Ensure `privileged: true` is set in the DaemonSet
* Verify capabilities include `SYS_ADMIN` and `NET_ADMIN`
* Check if Pod Security Policies/Standards are blocking privileged containers
To run without eBPF, set `ENABLE_EBPF=false` (metrics collection still works).
## Uninstalling
[Section titled “Uninstalling”](#uninstalling)
```bash
kubectl delete -f install.yaml
```
# Errors
> Track exceptions, stack traces, and error context from your applications
Track exceptions, stack traces, and error context from your applications
Cased Telemetry captures errors from your applications using the standard Sentry SDK. Errors are automatically grouped by fingerprint, enriched with context, and queryable by AI agents.
## Quick Start
[Section titled “Quick Start”](#quick-start)
### 1. Install the SDK
[Section titled “1. Install the SDK”](#1-install-the-sdk)
```bash
uv pip install sentry-sdk
```
### 2. Configure Your DSN
[Section titled “2. Configure Your DSN”](#2-configure-your-dsn)
```python
import sentry_sdk
sentry_sdk.init(
dsn="https://abc123@telemetry.cased.com/1", # Your Cased DSN
traces_sample_rate=1.0,
)
```
For Node.js:
```bash
npm install @sentry/node
```
```javascript
const Sentry = require("@sentry/node");
Sentry.init({
dsn: "https://abc123@telemetry.cased.com/1",
tracesSampleRate: 1.0,
});
```
## What Gets Captured
[Section titled “What Gets Captured”](#what-gets-captured)
When an exception occurs, the SDK captures:
* **Exception type and message** - The error class and description
* **Stack trace** - Full call stack with file names and line numbers
* **Request context** - URL, HTTP method, headers, body (if configured)
* **User context** - User ID, email, IP address (if configured)
* **Tags and extra data** - Custom metadata you add
* **Breadcrumbs** - Recent events leading up to the error
## Error Grouping
[Section titled “Error Grouping”](#error-grouping)
Errors are grouped by **fingerprint** - a hash of the exception type and stack trace. This means:
* The same error occurring multiple times creates one issue with a count
* You won’t get spammed with duplicate notifications
* Agents can identify “47 occurrences of the same error” vs “47 different errors”
## CLI Commands
[Section titled “CLI Commands”](#cli-commands)
Query errors from the command line:
```bash
# Recent errors
cased errors --since 1h
# Search for specific errors
cased errors --query "TimeoutError"
# Filter by level
cased errors --level error --since 24h
# Get details for a specific error
cased errors --event-id abc123
```
## API Endpoints
[Section titled “API Endpoints”](#api-endpoints)
### Query Errors
[Section titled “Query Errors”](#query-errors)
```bash
curl -H "Authorization: Token YOUR_API_KEY" \
"https://app.cased.com/api/v1/telemetry/errors?action=recent&hours_back=24"
```
### Search Errors
[Section titled “Search Errors”](#search-errors)
```bash
curl -H "Authorization: Token YOUR_API_KEY" \
"https://app.cased.com/api/v1/telemetry/errors?action=search&query=TimeoutError"
```
## Slack Notifications
[Section titled “Slack Notifications”](#slack-notifications)
Get notified in Slack when new error types are detected. Configure a Slack channel per project, and Cased sends a notification the first time each unique error is seen.
Errors are grouped by fingerprint, so you won’t get spammed with duplicates.
## Source Maps
[Section titled “Source Maps”](#source-maps)
For JavaScript applications, [upload source maps](/telemetry/source-maps) to see original source locations instead of minified code in stack traces.
## Data Retention
[Section titled “Data Retention”](#data-retention)
Error events are retained for **90 days**.
# LLM Monitoring
> Track LLM usage, costs, latency, and errors across your AI applications
Track LLM usage, costs, latency, and errors across your AI applications
Cased Telemetry provides observability for LLM calls in your applications. Track token usage, estimate costs, monitor latency, and debug errors across all your AI/LLM integrations.
## Quick Start
[Section titled “Quick Start”](#quick-start)
### 1. Get Your DSN
[Section titled “1. Get Your DSN”](#1-get-your-dsn)
Create a telemetry project in Cased and copy your DSN. It looks like:
```plaintext
https://@app.cased.com/api/
```
### 2. Instrument Your Code
[Section titled “2. Instrument Your Code”](#2-instrument-your-code)
* Python
```python
import requests
CASED_DSN = "https://abc123@app.cased.com/api/1"
def track_llm_call(model, provider, input_tokens, output_tokens, latency_ms, **kwargs):
"""Send LLM call metrics to Cased."""
# Parse DSN
import re
match = re.match(r'https://([^@]+)@([^/]+)/api/(\d+)', CASED_DSN)
public_key, host, project_id = match.groups()
requests.post(
f"https://{host}/api/{project_id}/llm/",
headers={
"X-Sentry-Auth": f"Sentry sentry_key={public_key}",
"Content-Type": "application/json"
},
json={
"model": model,
"provider": provider,
"input_tokens": input_tokens,
"output_tokens": output_tokens,
"latency_ms": latency_ms,
**kwargs
}
)
# Example: Track an OpenAI call
import time
import openai
start = time.time()
response = openai.chat.completions.create(
model="gpt-5-2",
messages=[{"role": "user", "content": "Hello!"}]
)
latency = (time.time() - start) * 1000
track_llm_call(
model="gpt-5-2",
provider="openai",
input_tokens=response.usage.prompt_tokens,
output_tokens=response.usage.completion_tokens,
latency_ms=latency,
session_id="conversation-123", # Group multi-turn conversations
trace_id="rag-pipeline-456", # Group related LLM calls
)
```
* TypeScript
```typescript
const CASED_DSN = "https://abc123@app.cased.com/api/1";
async function trackLLMCall(data: {
model: string;
provider: string;
input_tokens: number;
output_tokens: number;
latency_ms: number;
session_id?: string;
trace_id?: string;
success?: boolean;
error?: string;
}) {
const match = CASED_DSN.match(/https:\/\/([^@]+)@([^/]+)\/api\/(\d+)/);
if (!match) throw new Error("Invalid DSN");
const [, publicKey, host, projectId] = match;
await fetch(`https://${host}/api/${projectId}/llm/`, {
method: "POST",
headers: {
"X-Sentry-Auth": `Sentry sentry_key=${publicKey}`,
"Content-Type": "application/json",
},
body: JSON.stringify(data),
});
}
// Example: Track an OpenAI call
const start = Date.now();
const response = await openai.chat.completions.create({
model: "gpt-5-2",
messages: [{ role: "user", content: "Hello!" }],
});
await trackLLMCall({
model: "gpt-5-2",
provider: "openai",
input_tokens: response.usage.prompt_tokens,
output_tokens: response.usage.completion_tokens,
latency_ms: Date.now() - start,
session_id: "conversation-123",
});
```
## Event Fields
[Section titled “Event Fields”](#event-fields)
| Field | Type | Required | Description |
| --------------- | ------ | -------- | ------------------------------------------------- |
| `model` | string | Yes | Model name (e.g., `gpt-5-2`, `claude-sonnet-4-5`) |
| `provider` | string | No | Provider name (e.g., `openai`, `anthropic`) |
| `input_tokens` | int | No | Number of input/prompt tokens |
| `output_tokens` | int | No | Number of output/completion tokens |
| `cached_tokens` | int | No | Number of cached tokens (prompt caching) |
| `latency_ms` | float | No | Request latency in milliseconds |
| `success` | bool | No | Whether the call succeeded (default: true) |
| `error` | string | No | Error message if call failed |
| `session_id` | string | No | Group multi-turn conversations |
| `trace_id` | string | No | Group related LLM calls (e.g., RAG pipeline) |
| `tags` | object | No | Custom key-value tags |
| `environment` | string | No | Environment name (default: `production`) |
| `release` | string | No | Application version |
## Grouping Calls
[Section titled “Grouping Calls”](#grouping-calls)
### Session ID
[Section titled “Session ID”](#session-id)
Use `session_id` to group multi-turn conversations:
```python
# All calls in a conversation share the same session_id
track_llm_call(model="gpt-5-2", session_id="conv-abc123", ...)
track_llm_call(model="gpt-5-2", session_id="conv-abc123", ...) # Same session
```
### Trace ID
[Section titled “Trace ID”](#trace-id)
Use `trace_id` to group related LLM calls in a pipeline:
```python
# RAG pipeline: embedding + retrieval + generation
trace_id = "rag-" + str(uuid.uuid4())
track_llm_call(model="text-embedding-3-small", trace_id=trace_id, ...) # Embedding
track_llm_call(model="gpt-5-2", trace_id=trace_id, ...) # Generation
```
## Batch Ingestion
[Section titled “Batch Ingestion”](#batch-ingestion)
For high-volume applications, send multiple events in a single request:
```python
requests.post(
f"https://{host}/api/{project_id}/llm/batch/",
headers={"X-Sentry-Auth": f"Sentry sentry_key={public_key}"},
json={
"events": [
{"model": "gpt-5-2", "input_tokens": 100, ...},
{"model": "gpt-5-2", "input_tokens": 150, ...},
{"model": "claude-sonnet-4-5", "input_tokens": 200, ...},
]
}
)
```
Maximum batch size: 100 events.
## Query API
[Section titled “Query API”](#query-api)
Query your LLM metrics via the API or CLI.
### Usage Statistics
[Section titled “Usage Statistics”](#usage-statistics)
```bash
curl -H "Authorization: Token YOUR_API_KEY" \
"https://app.cased.com/api/v1/telemetry/query/llm/usage/?since=24h&group_by=model"
```
Response:
```json
{
"usage_stats": [
{
"model": "gpt-5-2",
"call_count": 1250,
"total_input_tokens": 2500000,
"total_output_tokens": 750000
}
],
"totals": {
"calls": 1250,
"input_tokens": 2500000,
"output_tokens": 750000
}
}
```
### Cost Estimates
[Section titled “Cost Estimates”](#cost-estimates)
```bash
curl -H "Authorization: Token YOUR_API_KEY" \
"https://app.cased.com/api/v1/telemetry/query/llm/cost/?since=24h"
```
### Latency Percentiles
[Section titled “Latency Percentiles”](#latency-percentiles)
```bash
curl -H "Authorization: Token YOUR_API_KEY" \
"https://app.cased.com/api/v1/telemetry/query/llm/latency/?since=1h"
```
Response includes p50, p95, p99 latencies:
```json
{
"latency_stats": [
{
"model": "gpt-5-2",
"avg_ms": 1234.5,
"p50_ms": 1100.0,
"p95_ms": 2500.0,
"p99_ms": 3200.0
}
]
}
```
### Error Analysis
[Section titled “Error Analysis”](#error-analysis)
```bash
curl -H "Authorization: Token YOUR_API_KEY" \
"https://app.cased.com/api/v1/telemetry/query/llm/errors/?since=24h"
```
### Session Rollups
[Section titled “Session Rollups”](#session-rollups)
Analyze cost and usage per conversation:
```bash
curl -H "Authorization: Token YOUR_API_KEY" \
"https://app.cased.com/api/v1/telemetry/query/llm/sessions/?sort_by=cost&limit=20"
```
## CLI Commands
[Section titled “CLI Commands”](#cli-commands)
If you have the [Cased CLI](/cli) installed:
```bash
# Token usage by model
cased llm usage --since 24h
# Cost estimates
cased llm cost --since 24h --model gpt-5-2
# Latency percentiles
cased llm latency --since 1h
# Error rates
cased llm errors --since 24h
# Overall summary
cased llm summary --since 24h
# Per-session analysis
cased llm sessions --sort-by cost --limit 20
```
## Supported Models
[Section titled “Supported Models”](#supported-models)
Cost estimates are calculated using current pricing for:
| Provider | Models |
| ------------- | ------------------------------------------------------ |
| **Anthropic** | Claude Opus 4.5, Sonnet 4.5, Haiku 4.5, and 3.x series |
| **OpenAI** | GPT-5.2, GPT-5, GPT-4.1, GPT-5-2, o3, o1 |
| **Google** | Gemini 3 Pro/Flash, 2.5/2.0 series |
| **Mistral** | Large, Medium 3, Small 3 |
| **DeepSeek** | V3, chat, reasoner |
| **Meta** | Llama 3.3-70b, 3.1-405b |
Unknown models use default pricing estimates.
# Logs
> Collect and query application logs (coming soon)
Collect and query application logs (coming soon)
Note
Log collection is coming soon. In the meantime, you can integrate with [BetterStack](/integrations/betterstack) or other logging providers.
Cased Telemetry will support log collection, allowing AI agents to correlate logs with errors, traces, and metrics for complete observability.
## Planned Features
[Section titled “Planned Features”](#planned-features)
* **Structured log ingestion** - JSON and plain text logs
* **Log correlation** - Link logs to traces and errors automatically
* **Agent-queryable** - Ask questions like “show me logs around this error”
* **Retention policies** - Configurable log retention
# Telemetry
> Agent-first error tracking and observability - no dashboards, just AI
Agent-first error tracking and observability - no dashboards, just AI
Cased Telemetry is **agent-first observability** - there’s no dashboard to check, no charts to interpret. Your telemetry data goes directly to AI agents that can query, analyze, and act on it.
## Why Agent-First?
[Section titled “Why Agent-First?”](#why-agent-first)
Traditional observability tools are built for humans staring at dashboards. You get paged, open a browser, click through charts, and manually investigate.
Today, we can do this better:
* **No context switching** - Ask your agent “why is the API slow?” and it queries your telemetry directly
* **Instant root cause analysis** - Agents correlate errors, metrics, and traces automatically
* **Automated remediation** - Agents can fix issues and open PRs, not just alert you
There’s no pre-baked Cased Telemetry dashboard. The API is the interface, and AI agents are the users.
## How It Works
[Section titled “How It Works”](#how-it-works)
```plaintext
Your Application Cased
┌──────────────────┐ ┌────────────────────────┐
│ SDK │───────────────────>│ │
│ (errors/traces) │ │ Telemetry Storage │
└──────────────────┘ │ │
│ │ │
┌──────────────────┐ │ ▼ │
│ cased-agent │───────────────────>│ ┌─────────────┐ │
│ (metrics) │ │ │ Query API │<─────┼─── AI Agents
└──────────────────┘ │ └─────────────┘ │ or Cased Agents
└────────────────────────┘
```
## Features
[Section titled “Features”](#features)
* **Sentry SDK Compatible** - Use the standard sentry-sdk, just change the DSN
* **Container Metrics** - cased-agent collects CPU, memory, network from Kubernetes
* **Distributed Tracing** - OpenTelemetry-compatible spans
* **LLM Monitoring** - Track token usage, costs, latency, and errors across AI integrations
* **Performance Analysis** - Detect slow spans, N+1 queries, and latency regressions
* **Slack Notifications** - Get notified when new error types appear
* **API & CLI** - Query everything via REST API or the [Cased CLI](/cli)
## Quick Start
[Section titled “Quick Start”](#quick-start)
### 1. Create a Telemetry Project
[Section titled “1. Create a Telemetry Project”](#1-create-a-telemetry-project)
Create a project in the Cased UI under **Connections → Cased Telemetry**, or via API:
```bash
curl -X POST https://app.cased.com/api/v1/telemetry/projects/ \
-H "Authorization: Bearer YOUR_API_KEY" \
-H "Content-Type: application/json" \
-d '{"name": "my-app"}'
```
Either way, you’ll get a DSN like:
```plaintext
https://abc123@telemetry.cased.com/1
```
### 2. Configure the SDK
[Section titled “2. Configure the SDK”](#2-configure-the-sdk)
Use the standard Sentry SDK - just point it at your Cased DSN:
```bash
uv pip install sentry-sdk
```
```python
import sentry_sdk
sentry_sdk.init(
dsn="https://abc123@telemetry.cased.com/1", # Your Cased DSN
traces_sample_rate=1.0,
)
```
For Node.js:
```bash
npm install @sentry/node
```
```javascript
const Sentry = require("@sentry/node");
Sentry.init({
dsn: "https://abc123@telemetry.cased.com/1", // Your Cased DSN
tracesSampleRate: 1.0,
});
```
### 3. (Optional) Deploy cased-agent for Infrastructure Metrics
[Section titled “3. (Optional) Deploy cased-agent for Infrastructure Metrics”](#3-optional-deploy-cased-agent-for-infrastructure-metrics)
Deploy the cased-agent DaemonSet to collect container metrics from your Kubernetes cluster:
```bash
kubectl apply -f https://raw.githubusercontent.com/cased/cased-agent/main/deploy/manifests/install.yaml
```
See [cased-agent Setup](/telemetry/cased-agent) for detailed configuration.
## Data Types
[Section titled “Data Types”](#data-types)
Cased Telemetry collects four types of data, each with its own collection method:
| Type | Source | What it captures |
| -------------- | ----------- | ------------------------------------------------ |
| **Errors** | Sentry SDK | Exceptions, stack traces, request context |
| **Traces** | Sentry SDK | Distributed spans, latency, service dependencies |
| **Metrics** | cased-agent | Container CPU, memory, network, restarts |
| **LLM Events** | Your code | Token usage, costs, latency per model |
### Errors (via Sentry SDK)
[Section titled “Errors (via Sentry SDK)”](#errors-via-sentry-sdk)
Captures exceptions with full context: stack traces, request data, user info, and custom tags. [Upload source maps](/telemetry/source-maps) to de-minify JavaScript traces.
### Traces (via Sentry SDK)
[Section titled “Traces (via Sentry SDK)”](#traces-via-sentry-sdk)
Distributed tracing across services. Analyze latency, find slow spans, detect N+1 queries. See [Traces](/telemetry/traces).
### Metrics (via cased-agent)
[Section titled “Metrics (via cased-agent)”](#metrics-via-cased-agent)
Container-level metrics from Kubernetes: CPU, memory, network I/O, OOM events. Requires [cased-agent](/telemetry/cased-agent) deployed as a DaemonSet.
### LLM Events (via your code)
[Section titled “LLM Events (via your code)”](#llm-events-via-your-code)
Track LLM calls with token counts, costs, and latency. Group by session or trace. See [LLM Monitoring](/telemetry/llm-monitoring).
## Data Retention
[Section titled “Data Retention”](#data-retention)
| Data Type | Retention |
| ------------ | --------- |
| Error Events | 90 days |
| LLM Events | 90 days |
| Metrics | 30 days |
| Traces | 14 days |
## Use with Coding Agents
[Section titled “Use with Coding Agents”](#use-with-coding-agents)
Once you’ve configured the [Cased CLI](/cli), your coding agent can query telemetry directly. Just ask:
```plaintext
"Using cased, what errors happened in the last hour?"
"Using cased, why is the checkout API slow?"
"Using cased, show me memory usage for the api-server pods"
```
No dashboards, no context switching—your agent queries errors, traces, and metrics, correlates them, and can even open PRs with fixes.
### Cased Agents
[Section titled “Cased Agents”](#cased-agents)
Cased also runs scheduled agent workflows that automatically:
* Detect error spikes and investigate root causes
* Monitor for performance regressions after deploys
* Track LLM cost anomalies
* Create PRs with fixes when issues are found
## Slack Notifications
[Section titled “Slack Notifications”](#slack-notifications)
Get notified in Slack when new error types are detected. Configure a Slack channel per project, and Cased will send a notification the first time each unique error is seen—with stack trace, context, and a link to investigate.
Errors are grouped by fingerprint, so you won’t get spammed with duplicates.
## Next Steps
[Section titled “Next Steps”](#next-steps)
* [Configure cased-agent](/telemetry/cased-agent) for infrastructure metrics
* [Monitor LLM usage](/telemetry/llm-monitoring) across your AI applications
* [Analyze traces](/telemetry/traces) to find bottlenecks and regressions
* [Upload source maps](/telemetry/source-maps) for JavaScript de-minification
* [Use the CLI](/cli) to query telemetry from your terminal
* [Query the API](/telemetry/api) for programmatic access
# Source Maps
> Upload source maps to de-minify JavaScript stack traces
Upload source maps to de-minify JavaScript stack traces
Source maps allow Cased to show original source code locations instead of minified JavaScript in error stack traces.
## Quick Start
[Section titled “Quick Start”](#quick-start)
### 1. Upload Source Maps
[Section titled “1. Upload Source Maps”](#1-upload-source-maps)
Use the Cased CLI to upload source maps during your build/deploy process:
```bash
# Install the CLI
uv tool install cased-cli
# Set your API key
export CASED_API_KEY=your-api-key
# Upload source maps for a release
cased sourcemaps upload -p my-project -r v1.2.3 dist/*.map
```
### 2. Tag Releases in Your SDK
[Section titled “2. Tag Releases in Your SDK”](#2-tag-releases-in-your-sdk)
Ensure your Sentry SDK is configured with a `release` tag that matches:
```python
import sentry_sdk
sentry_sdk.init(
dsn="https://abc123@telemetry.cased.com/1",
release="v1.2.3", # Must match the --release used in upload
)
```
```javascript
Sentry.init({
dsn: "https://abc123@telemetry.cased.com/1",
release: "v1.2.3",
});
```
### 3. View De-minified Stack Traces
[Section titled “3. View De-minified Stack Traces”](#3-view-de-minified-stack-traces)
When errors occur, stack traces will automatically show original source locations:
```plaintext
src/components/Checkout.tsx:142 → (minified: main.abc123.js:1)
src/utils/api.ts:89 → (minified: main.abc123.js:1)
```
## CLI Commands
[Section titled “CLI Commands”](#cli-commands)
### Upload
[Section titled “Upload”](#upload)
```bash
cased sourcemaps upload -p -r
```
Options:
* `--project, -p` - Telemetry project ID or slug (required)
* `--release, -r` - Release version, should match SDK config (required)
* `--url-prefix` - URL prefix to strip when matching files (optional)
### List
[Section titled “List”](#list)
```bash
cased sourcemaps list -p [-r ]
```
### Delete
[Section titled “Delete”](#delete)
```bash
cased sourcemaps delete -p -r
```
## API Endpoints
[Section titled “API Endpoints”](#api-endpoints)
### Upload Source Maps
[Section titled “Upload Source Maps”](#upload-source-maps)
```plaintext
POST /api/v1/telemetry/projects/{project_id}/sourcemaps/
Authorization: Bearer {api_key}
Content-Type: multipart/form-data
Fields:
release: string (required)
url_prefix: string (optional)
files: file[] (required, .map files)
```
### List Source Maps
[Section titled “List Source Maps”](#list-source-maps)
```plaintext
GET /api/v1/telemetry/projects/{project_id}/sourcemaps/
GET /api/v1/telemetry/projects/{project_id}/sourcemaps/?release=v1.0.0
Authorization: Bearer {api_key}
```
### Delete Source Maps
[Section titled “Delete Source Maps”](#delete-source-maps)
```plaintext
DELETE /api/v1/telemetry/projects/{project_id}/sourcemaps/{release}/
Authorization: Bearer {api_key}
```
## CI/CD Integration
[Section titled “CI/CD Integration”](#cicd-integration)
### GitHub Actions
[Section titled “GitHub Actions”](#github-actions)
```yaml
- name: Install Cased CLI
run: uv pip install cased-cli
- name: Upload Source Maps
env:
CASED_API_KEY: ${{ secrets.CASED_API_KEY }}
run: cased sourcemaps upload -p my-app -r ${{ github.sha }} dist/*.map
```
### Build Tool Integration
[Section titled “Build Tool Integration”](#build-tool-integration)
Most bundlers can generate source maps automatically:
**Vite:**
```javascript
export default {
build: {
sourcemap: true,
},
};
```
**Webpack:**
```javascript
module.exports = {
devtool: "source-map",
};
```
## How It Works
[Section titled “How It Works”](#how-it-works)
1. During build, your bundler generates `.map` files alongside minified JS
2. You upload these maps to Cased, tagged with a release version
3. Your SDK sends errors with the same release tag
4. When displaying stack traces, Cased maps minified locations back to original source
Source maps are stored securely and only accessible to your organization.
# Traces
> Distributed tracing to analyze latency, detect slow spans, and find N+1 queries
Distributed tracing to analyze latency, detect slow spans, and find N+1 queries
Cased Telemetry captures distributed traces via the **Sentry SDK** or **OpenTelemetry** (through cased-agent). Analyze latency, find slow spans, detect N+1 query patterns, and track performance regressions.
## Quick Start
[Section titled “Quick Start”](#quick-start)
```bash
# Find slow spans (>500ms)
cased perf slow --since 1h
# View latency percentiles
cased perf latency --since 1h --service api
# Detect N+1 query patterns
cased perf n1 --since 1h
# Check for regressions
cased perf regression --service api
```
## Commands
[Section titled “Commands”](#commands)
### Find Slow Spans
[Section titled “Find Slow Spans”](#find-slow-spans)
Identify spans that exceed a latency threshold:
```bash
# Find spans slower than 500ms (default)
cased perf slow --since 1h
# Custom threshold (1 second)
cased perf slow --since 24h --threshold 1000
# Filter by service
cased perf slow --service api --since 1h
```
**Options:**
| Option | Description | Default |
| ------------- | ------------------------ | ------- |
| `--since` | Time range (1h, 24h, 7d) | 1h |
| `--threshold` | Minimum duration in ms | 500 |
| `--service` | Filter by service name | - |
| `--limit` | Max results | 50 |
### Latency Percentiles
[Section titled “Latency Percentiles”](#latency-percentiles)
View p50, p95, p99 latencies grouped by service or endpoint:
```bash
# Overall latency by service
cased perf latency --since 1h
# Group by endpoint
cased perf latency --service api --group-by endpoint
# Both service and endpoint
cased perf latency --since 24h --group-by both
```
**Output:**
```plaintext
Service p50 p95 p99 Count
─────────────────────────────────────────────────
api 45ms 120ms 350ms 12,450
worker 230ms 890ms 1.2s 3,200
gateway 12ms 35ms 78ms 45,000
```
**Options:**
| Option | Description | Default |
| ------------ | -------------------------- | ------- |
| `--since` | Time range | 1h |
| `--service` | Filter by service | - |
| `--group-by` | service, endpoint, or both | service |
### Detect N+1 Queries
[Section titled “Detect N+1 Queries”](#detect-n1-queries)
Find repeated similar operations that indicate N+1 query patterns:
```bash
# Find N+1 patterns
cased perf n1 --since 1h
# Require more repetitions to flag
cased perf n1 --min-count 10
```
**Output:**
```plaintext
Pattern Count Trace Example
────────────────────────────────────────────────────────────
SELECT * FROM users WHERE id = ? 47 abc123
SELECT * FROM orders WHERE user_id 23 def456
```
**Options:**
| Option | Description | Default |
| ------------- | --------------------------- | ------- |
| `--since` | Time range | 1h |
| `--min-count` | Minimum repetitions to flag | 5 |
### Trace Breakdown
[Section titled “Trace Breakdown”](#trace-breakdown)
Get a detailed service breakdown for a specific trace:
```bash
cased perf breakdown
```
**Output:**
```plaintext
Trace: abc123def456
Total Duration: 1.2s
Service Duration % of Total Spans
──────────────────────────────────────────────────
database 680ms 56.7% 12
api 320ms 26.7% 3
redis 150ms 12.5% 8
external-api 50ms 4.2% 1
```
### Detect Regressions
[Section titled “Detect Regressions”](#detect-regressions)
Compare recent performance against a baseline period:
```bash
# Compare last day to last week
cased perf regression --service api
# Custom periods
cased perf regression --service api --baseline 7d --compare 1d
# Filter by endpoint
cased perf regression --service api --endpoint /api/users
```
**Output:**
```plaintext
Endpoint Baseline p95 Current p95 Change
────────────────────────────────────────────────────────────
/api/users 45ms 120ms +167% ⚠️
/api/orders 230ms 245ms +7%
/api/health 5ms 5ms 0%
```
**Options:**
| Option | Description | Default |
| ------------ | ----------------------------- | ------- |
| `--service` | Service to analyze (required) | - |
| `--endpoint` | Filter by endpoint | - |
| `--baseline` | Baseline period | 7d |
| `--compare` | Comparison period | 1d |
### Performance Summary
[Section titled “Performance Summary”](#performance-summary)
Get an overall summary of system performance:
```bash
cased perf summary --since 1h
```
**Output:**
```plaintext
Performance Summary (last 1h)
─────────────────────────────
Total Traces: 45,230
Total Spans: 234,500
Error Rate: 0.3%
Latency (all services):
p50: 34ms
p95: 180ms
p99: 450ms
Slowest Services:
1. database avg: 89ms
2. external-api avg: 67ms
3. worker avg: 45ms
```
## API Endpoints
[Section titled “API Endpoints”](#api-endpoints)
All performance data is also available via REST API:
### Slow Spans
[Section titled “Slow Spans”](#slow-spans)
```bash
curl -H "Authorization: Token YOUR_API_KEY" \
"https://app.cased.com/api/v1/telemetry/traces/slow?since=1h&threshold=500"
```
### Latency Percentiles
[Section titled “Latency Percentiles”](#latency-percentiles-1)
```bash
curl -H "Authorization: Token YOUR_API_KEY" \
"https://app.cased.com/api/v1/telemetry/traces/latency?since=1h&group_by=service"
```
### N+1 Detection
[Section titled “N+1 Detection”](#n1-detection)
```bash
curl -H "Authorization: Token YOUR_API_KEY" \
"https://app.cased.com/api/v1/telemetry/traces/n1?since=1h&min_count=5"
```
## Investigation Workflow
[Section titled “Investigation Workflow”](#investigation-workflow)
A typical performance investigation workflow:
1. **Start with summary** to get an overview:
```bash
cased perf summary --since 1h
```
2. **Check for regressions** if latency increased:
```bash
cased perf regression --service api
```
3. **Find slow spans** to identify bottlenecks:
```bash
cased perf slow --service api --since 1h
```
4. **Check for N+1 queries** if database is slow:
```bash
cased perf n1 --since 1h
```
5. **Drill into a specific trace** for details:
```bash
cased perf breakdown
```
## Alerting
[Section titled “Alerting”](#alerting)
Set up alerts based on performance thresholds using Cased workflows.
# Optimize cloud costs
> Cased analyzes your AWS infrastructure to identify cost optimization opportunities, including underutilized resources, idle instances, oversized services, and inefficient configurations that are driving up your cloud costs.
Cased analyzes your AWS infrastructure to identify cost optimization opportunities, including underutilized resources, idle instances, oversized services, and inefficient configurations that are driving up your cloud costs.
Cloud costs can quickly spiral out of control without proper monitoring and optimization. Cased provides intelligent cost analysis that goes beyond simple billing reports to identify specific optimization opportunities and provide actionable recommendations for reducing your AWS spend.
## How it Works
[Section titled “How it Works”](#how-it-works)
Cased’s cost optimization combines real-time infrastructure analysis with usage pattern recognition:
1. **Resource Discovery**: Scan your AWS infrastructure to catalog all resources and their configurations
2. **Utilization Analysis**: Monitor CPU, memory, network, and storage utilization patterns over time
3. **Cost Correlation**: Correlate resource usage with AWS billing data to identify cost drivers
4. **Optimization Identification**: Use AI to identify specific optimization opportunities
5. **Recommendation Generation**: Provide actionable recommendations with estimated savings
## Cost Optimization Categories
[Section titled “Cost Optimization Categories”](#cost-optimization-categories)
### Compute Optimization
[Section titled “Compute Optimization”](#compute-optimization)
* **Right-sizing EC2 Instances**: Identify oversized instances that can be downsized
* **Reserved Instance Opportunities**: Recommend Reserved Instance purchases for predictable workloads
* **Spot Instance Usage**: Identify workloads suitable for Spot instances
* **Instance Scheduling**: Detect instances that can be scheduled (dev/test environments)
### Storage Optimization
[Section titled “Storage Optimization”](#storage-optimization)
* **EBS Volume Right-sizing**: Identify oversized EBS volumes
* **Storage Class Optimization**: Recommend appropriate S3 storage classes
* **Snapshot Management**: Identify old or unnecessary snapshots
* **Unattached Resources**: Find unattached EBS volumes and Elastic IPs
### Database Optimization
[Section titled “Database Optimization”](#database-optimization)
* **RDS Right-sizing**: Analyze RDS instance utilization and recommend sizing
* **Multi-AZ Analysis**: Evaluate if Multi-AZ is necessary for all databases
* **Read Replica Optimization**: Optimize read replica configurations
* **Database Engine Efficiency**: Recommend more cost-effective database engines
### Network Optimization
[Section titled “Network Optimization”](#network-optimization)
* **Data Transfer Analysis**: Identify expensive data transfer patterns
* **NAT Gateway Optimization**: Optimize NAT Gateway usage and placement
* **Load Balancer Efficiency**: Analyze load balancer necessity and configuration
* **VPC Endpoint Opportunities**: Recommend VPC endpoints to reduce data transfer costs
## Intelligent Analysis Features
[Section titled “Intelligent Analysis Features”](#intelligent-analysis-features)
### Usage Pattern Recognition
[Section titled “Usage Pattern Recognition”](#usage-pattern-recognition)
```plaintext
Example Analysis Output:
EC2 Instance: i-0123456789abcdef0
- Instance Type: m5.xlarge ($0.192/hour)
- Average CPU: 15%
- Average Memory: 25%
- Recommendation: Downsize to m5.large
- Estimated Monthly Savings: $69.12
RDS Instance: myapp-prod-db
- Instance Type: db.r5.2xlarge ($0.504/hour)
- Average CPU: 8%
- Average Connections: 12
- Recommendation: Downsize to db.r5.large
- Estimated Monthly Savings: $181.44
```
### Idle Resource Detection
[Section titled “Idle Resource Detection”](#idle-resource-detection)
* **Zero-Activity Instances**: Identify EC2 instances with no activity
* **Unused Load Balancers**: Find load balancers with no traffic
* **Orphaned Resources**: Detect resources not associated with active applications
* **Development Resource Cleanup**: Identify forgotten development resources
### Scheduling Opportunities
[Section titled “Scheduling Opportunities”](#scheduling-opportunities)
* **Development Environments**: Identify dev/test resources that can be scheduled
* **Batch Processing**: Optimize batch job resource allocation
* **Seasonal Workloads**: Identify workloads with predictable usage patterns
* **Weekend Shutdown**: Find resources that can be shut down during off-hours
## Automated Recommendations
[Section titled “Automated Recommendations”](#automated-recommendations)
### Infrastructure as Code Updates
[Section titled “Infrastructure as Code Updates”](#infrastructure-as-code-updates)
Cased can generate Terraform updates to implement optimizations:
```hcl
# Example Terraform optimization generated by Cased
resource "aws_instance" "web_server" {
# Changed from m5.xlarge to m5.large based on utilization analysis
instance_type = "m5.large" # Previous: m5.xlarge
# Added scheduling for development environment
tags = {
Name = "web-server-dev"
Schedule = "weekdays-9to5" # New: Auto-shutdown schedule
}
}
# New: Reserved Instance recommendation
resource "aws_ec2_reserved_instance" "web_server_ri" {
instance_type = "m5.large"
instance_count = 2
offering_type = "All Upfront"
# Estimated savings: $1,200/year
}
```
### Policy Recommendations
[Section titled “Policy Recommendations”](#policy-recommendations)
* **Lifecycle Policies**: Automated S3 lifecycle policies for cost optimization
* **Auto Scaling Policies**: Optimize auto scaling configurations
* **Backup Policies**: Optimize backup retention and frequency
* **Access Policies**: Identify unused IAM roles and policies
## Cost Tracking and Reporting
[Section titled “Cost Tracking and Reporting”](#cost-tracking-and-reporting)
### Savings Tracking
[Section titled “Savings Tracking”](#savings-tracking)
* **Before/After Analysis**: Track cost reductions from implemented optimizations
* **ROI Calculation**: Calculate return on investment for optimization efforts
* **Trend Analysis**: Monitor cost trends over time
* **Budget Impact**: Show how optimizations affect budget forecasts
### Custom Reporting
[Section titled “Custom Reporting”](#custom-reporting)
```plaintext
Monthly Cost Optimization Report:
💰 Total Potential Savings Identified: $2,847/month
🔧 Optimization Opportunities:
- EC2 Right-sizing: $1,234/month (8 instances)
- RDS Optimization: $567/month (3 databases)
- Storage Cleanup: $345/month (unused volumes)
- Reserved Instance: $701/month (annual commitment)
📊 Implementation Status:
- Completed: $1,200/month (42% of potential)
- In Progress: $890/month (31% of potential)
- Planned: $757/month (27% of potential)
🎯 Quick Wins (< 1 hour implementation):
- Delete 12 unused EBS snapshots: $89/month
- Terminate 3 idle EC2 instances: $234/month
- Optimize S3 storage classes: $156/month
```
## Integration Examples
[Section titled “Integration Examples”](#integration-examples)
### Automated Cost Analysis
[Section titled “Automated Cost Analysis”](#automated-cost-analysis)
```yaml
name: Weekly Cost Analysis
on:
schedule:
- cron: "0 9 * * 1" # Every Monday at 9 AM
jobs:
cost-analysis:
runs-on: ubuntu-latest
steps:
- name: Run Cost Analysis
run: |
curl -X POST https://app.cased.com/api/v1/cost-analysis/ \
-H "Authorization: Bearer ${{ secrets.CASED_API_KEY }}" \
-H "Content-Type: application/json" \
-d '{
"analysis_type": "comprehensive",
"generate_recommendations": true,
"create_issues": true
}'
```
### Slack Integration
[Section titled “Slack Integration”](#slack-integration)
```yaml
- name: Send Cost Report to Slack
uses: cased/slack-notification-action@v1
with:
webhook_url: ${{ secrets.SLACK_WEBHOOK }}
message: |
📊 Weekly Cost Optimization Report
💰 Potential Savings: $2,847/month
🔧 New Opportunities: 12 items
✅ Completed This Week: $456/month saved
Top Recommendations:
• Right-size m5.xlarge instances (8 found)
• Clean up unused EBS volumes (23 found)
• Implement S3 lifecycle policies (5 buckets)
```
## Best Practices
[Section titled “Best Practices”](#best-practices)
### Regular Analysis
[Section titled “Regular Analysis”](#regular-analysis)
1. **Weekly Reviews**: Run cost analysis weekly to catch new optimization opportunities
2. **Monthly Deep Dives**: Perform comprehensive analysis monthly
3. **Quarterly Planning**: Align cost optimization with capacity planning
4. **Annual Budgeting**: Use optimization insights for annual budget planning
### Implementation Strategy
[Section titled “Implementation Strategy”](#implementation-strategy)
1. **Quick Wins First**: Implement easy optimizations to build momentum
2. **Risk Assessment**: Evaluate business impact before making changes
3. **Gradual Implementation**: Roll out changes gradually to minimize risk
4. **Monitoring**: Monitor performance after optimizations
### Team Collaboration
[Section titled “Team Collaboration”](#team-collaboration)
1. **Shared Responsibility**: Make cost optimization a team responsibility
2. **Regular Reviews**: Include cost optimization in sprint planning
3. **Documentation**: Document optimization decisions and their outcomes
4. **Knowledge Sharing**: Share cost optimization learnings across teams
## Advanced Features
[Section titled “Advanced Features”](#advanced-features)
### Predictive Analysis
[Section titled “Predictive Analysis”](#predictive-analysis)
* **Seasonal Forecasting**: Predict cost changes based on seasonal patterns
* **Growth Projections**: Forecast costs based on application growth
* **Optimization Impact**: Predict the impact of proposed optimizations
* **Budget Variance**: Predict budget variance based on current trends
### Custom Optimization Rules
[Section titled “Custom Optimization Rules”](#custom-optimization-rules)
```yaml
# Example custom optimization rules
optimization_rules:
compute:
- name: "Dev Environment Scheduling"
condition: "environment == 'dev' AND cpu_avg < 20%"
action: "schedule_shutdown"
schedule: "weekdays-18:00-to-08:00"
- name: "Underutilized Production"
condition: "environment == 'prod' AND cpu_avg < 30% AND memory_avg < 40%"
action: "recommend_downsize"
approval_required: true
storage:
- name: "Old Snapshot Cleanup"
condition: "age > 90_days AND not_used_for_ami"
action: "delete_snapshot"
approval_required: false
```
### Multi-Account Analysis
[Section titled “Multi-Account Analysis”](#multi-account-analysis)
* **Cross-Account Optimization**: Analyze costs across multiple AWS accounts
* **Consolidated Reporting**: Unified cost optimization reports
* **Account Comparison**: Compare optimization opportunities across accounts
* **Shared Resource Optimization**: Optimize shared resources like NAT gateways
Cost optimization with Cased transforms cloud cost management from a reactive process into a proactive, data-driven practice that continuously identifies and implements cost savings opportunities.
# Fix infrastructure drift
> Cased can continuously monitor your cloud infrastructure and automatically detect when the running configuration drifts from what's defined in your infrastructure-as-code (IaC).
Cased can continuously monitor your cloud infrastructure and automatically detect when the running configuration drifts from what's defined in your infrastructure-as-code (IaC).
Drift is a common problem in modern infrastructure management. It occurs when changes are made to your infrastructure outside of your normal IaC workflow, leading to a discrepancy between what’s defined in your code and what’s actually running. This can lead to security vulnerabilities, compliance issues, and unexpected behavior.
## How it Works
[Section titled “How it Works”](#how-it-works)
Cased’s drift detection works by periodically scanning your cloud environment and comparing the state of your resources to the state defined in your Terraform state file.
1. **Configuration**: You configure a new `InfraMetadata` object in Cased, telling it where to find your Terraform state file in an S3 bucket.
2. **Periodic Scans**: Cased runs a periodic background task that reads your Terraform state and compares it to the actual state of your resources in your cloud provider.
3. **Task Creation**: If any drift is detected, Cased automatically creates a new task in Mission Control. This task will contain detailed information about the drift, including the resource that has drifted and the specific changes that were detected.
4. **Notification**: You and your team can see the new task in Mission Control and take action to resolve the drift.
## Getting Started
[Section titled “Getting Started”](#getting-started)
To enable drift detection, you need to provide Cased with read-only access to the S3 bucket where you store your Terraform state file. Once you’ve configured the integration, Cased will begin scanning your infrastructure for drift automatically.
# Track and fix flaky tests
> Flaky tests kill productivity. They erode test suite confidence, slow deployments, and waste developer time. Cased detects flaky tests intelligently and remediates them automatically.
Flaky tests kill productivity. They erode test suite confidence, slow deployments, and waste developer time. Cased detects flaky tests intelligently and remediates them automatically.
## How Flaky Test Management Works
[Section titled “How Flaky Test Management Works”](#how-flaky-test-management-works)
Cased combines data analysis with automated remediation:
1. **Test Execution Monitoring**: Monitors CI/CD pipeline test results across runs
2. **Pattern Analysis**: Analyzes failure patterns to identify flaky behavior
3. **Flakiness Scoring**: Scores tests by failure frequency, inconsistency, and impact
4. **Automated Remediation**: Creates pull requests to fix or remove flaky tests
5. **Continuous Monitoring**: Catches new flaky tests through ongoing analysis
## Flaky Test Detection
[Section titled “Flaky Test Detection”](#flaky-test-detection)
### Statistical Analysis
[Section titled “Statistical Analysis”](#statistical-analysis)
* **Failure Rate Tracking**: Tracks test pass/fail rates over time
* **Consistency Scoring**: Identifies inconsistent failures across identical conditions
* **Environmental Correlation**: Detects environment-specific failures
* **Timing Analysis**: Finds timing issues and race conditions
### Pattern Recognition
[Section titled “Pattern Recognition”](#pattern-recognition)
* **Error Message Analysis**: Groups similar failures and identifies root causes
* **Dependency Mapping**: Maps test dependencies and cascading failures
* **Historical Trends**: Tracks test reliability changes over time
* **Impact Assessment**: Measures flaky test impact on pipeline reliability
## Supported Test Frameworks
[Section titled “Supported Test Frameworks”](#supported-test-frameworks)
### JavaScript/TypeScript
[Section titled “JavaScript/TypeScript”](#javascripttypescript)
* **Jest**: Full support for Jest test results and reporting
* **Vitest**: Native integration with Vitest test runner
* **Mocha**: Analysis of Mocha test outputs and failure patterns
* **Cypress**: End-to-end test flakiness detection
### Python
[Section titled “Python”](#python)
* **pytest**: Comprehensive pytest result analysis
* **unittest**: Standard Python unittest framework support
* **nose**: Legacy nose framework compatibility
### Other Languages
[Section titled “Other Languages”](#other-languages)
* **JUnit**: Java test framework analysis
* **RSpec**: Ruby test framework support
* **Go Test**: Native Go testing framework
* **PHPUnit**: PHP test framework integration
## Automated Remediation
[Section titled “Automated Remediation”](#automated-remediation)
### Pull Request Generation
[Section titled “Pull Request Generation”](#pull-request-generation)
Cased creates pull requests automatically to address flaky tests:
```markdown
# Example PR Description Generated by Cased
## Flaky Test Remediation
This PR addresses flaky tests identified in the test suite:
### Tests Modified:
- `test_user_authentication_flow` - Added retry logic for network calls
- `test_database_connection` - Improved connection cleanup
- `test_async_operation` - Fixed race condition with proper awaits
### Tests Removed:
- `test_deprecated_feature` - Consistently failing, feature removed
- `test_flaky_integration` - Unreliable external dependency
### Analysis:
- 3 tests showed >30% failure rate over last 30 days
- 2 tests had inconsistent failures across environments
- Total pipeline reliability improved from 85% to 96%
```
### Remediation Strategies
[Section titled “Remediation Strategies”](#remediation-strategies)
#### Test Stabilization
[Section titled “Test Stabilization”](#test-stabilization)
* **Retry Logic**: Adds intelligent retries for network-dependent tests
* **Wait Conditions**: Implements proper waits for async operations
* **Mock Improvements**: Replaces unreliable external dependencies
* **Resource Cleanup**: Ensures proper test resource cleanup
#### Test Removal
[Section titled “Test Removal”](#test-removal)
* **Deprecated Features**: Removes tests for non-existent features
* **Redundant Coverage**: Eliminates duplicate test coverage
* **Unmaintainable Tests**: Removes overly complex or unreliable tests
## Integration Examples
[Section titled “Integration Examples”](#integration-examples)
### GitHub Actions Integration
[Section titled “GitHub Actions Integration”](#github-actions-integration)
```yaml
name: Flaky Test Analysis
on:
schedule:
- cron: "0 2 * * *" # Daily at 2 AM
workflow_dispatch:
jobs:
analyze-flaky-tests:
runs-on: ubuntu-latest
steps:
- uses: actions/checkout@v4
- name: Run Test Suite
run: npm test -- --reporter=json > test-results.json
continue-on-error: true
- name: Analyze with Cased
run: |
curl -X POST https://app.cased.com/api/v1/test-analysis/ \
-H "Authorization: Bearer ${{ secrets.CASED_API_KEY }}" \
-H "Content-Type: application/json" \
-d '{
"repository": "${{ github.repository }}",
"test_results": "'$(cat test-results.json | base64 -w 0)'",
"commit_sha": "${{ github.sha }}"
}'
```
### CI/CD Pipeline Integration
[Section titled “CI/CD Pipeline Integration”](#cicd-pipeline-integration)
.github/workflows/test-and-analyze.yml
```yaml
name: Test and Flaky Analysis
on: [push, pull_request]
jobs:
test:
runs-on: ubuntu-latest
steps:
- uses: actions/checkout@v4
- name: Run Tests
run: |
npm test -- --reporter=json --outputFile=test-results.json
echo "TEST_EXIT_CODE=$?" >> $GITHUB_ENV
continue-on-error: true
- name: Report to Cased
if: always()
uses: cased/test-analysis-action@v1
with:
api_key: ${{ secrets.CASED_API_KEY }}
test_results_file: test-results.json
create_pr_on_flaky: true
```
## Flaky Test Dashboard
[Section titled “Flaky Test Dashboard”](#flaky-test-dashboard)
### Mission Control Integration
[Section titled “Mission Control Integration”](#mission-control-integration)
* **Flaky Test Overview**: Dashboard showing all identified flaky tests
* **Trend Analysis**: Historical view of test reliability improvements
* **Impact Metrics**: Measure how flaky tests affect deployment frequency
* **Remediation Tracking**: Track the status of automated fixes
### Key Metrics
[Section titled “Key Metrics”](#key-metrics)
* **Overall Test Reliability**: Percentage of test runs that pass completely
* **Flaky Test Count**: Number of tests identified as flaky
* **Time to Fix**: Average time from detection to remediation
* **Pipeline Impact**: How flaky tests affect deployment speed
## Best Practices
[Section titled “Best Practices”](#best-practices)
### Test Writing
[Section titled “Test Writing”](#test-writing)
1. **Isolation**: Ensure tests don’t depend on each other
2. **Deterministic**: Avoid random data or timing dependencies
3. **Cleanup**: Properly clean up resources after each test
4. **Mocking**: Mock external dependencies and network calls
### Flaky Test Management
[Section titled “Flaky Test Management”](#flaky-test-management)
1. **Regular Analysis**: Run flaky test analysis regularly, not just when problems occur
2. **Immediate Action**: Address flaky tests as soon as they’re identified
3. **Root Cause Analysis**: Understand why tests are flaky, don’t just add retries
4. **Team Communication**: Share flaky test reports with the development team
### CI/CD Integration
[Section titled “CI/CD Integration”](#cicd-integration)
1. **Fail Fast**: Don’t let flaky tests slow down your pipeline
2. **Parallel Analysis**: Run flaky test analysis in parallel with regular CI
3. **Automated Remediation**: Enable automatic PR creation for obvious fixes
4. **Monitoring**: Continuously monitor test reliability metrics
## Team Collaboration
[Section titled “Team Collaboration”](#team-collaboration)
* **Slack Notifications**: Get notified when flaky tests are detected or fixed
* **Assignment**: Automatically assign flaky test fixes to relevant team members
* **Progress Tracking**: Track team progress on flaky test remediation
* **Cross-Environment Comparison**: Compare test reliability across different environments
Managing flaky tests with Cased transforms a major development pain point into an automated, manageable process that improves overall development velocity and deployment confidence.
# Monitor deployments
> Go beyond simple threshold alerts to detect meaningful performance changes and potential issues before they impact people using your product.
Go beyond simple threshold alerts to detect meaningful performance changes and potential issues before they impact people using your product.
## How it Works
[Section titled “How it Works”](#how-it-works)
Cased’s deployment monitoring enables AI analysis to detect anomalies and handle post-deploy observability:
1. **Baseline Establishment**: Cased analyzes historical metrics to establish normal performance baselines for your applications
2. **Real-time Monitoring**: During and after deployments, Cased continuously monitors key metrics against these baselines
3. **Anomaly Detection**: AI algorithms detect significant deviations from normal patterns, not just threshold breaches
4. **Contextual Analysis**: Cased correlates multiple metrics to provide meaningful insights about deployment health
## Monitored Metrics
[Section titled “Monitored Metrics”](#monitored-metrics)
### Resource Metrics
[Section titled “Resource Metrics”](#resource-metrics)
* **CPU Utilization**: Detects unusual CPU spikes or sustained high usage
* **Memory Usage**: Monitors memory pressure and potential memory leaks
* **Disk I/O**: Tracks read/write latency and throughput changes
* **Network Traffic**: Monitors network utilization and packet loss
### Application Metrics
[Section titled “Application Metrics”](#application-metrics)
* **Error Rates**: Detects increases in 4xx and 5xx HTTP errors
* **Response Times**: Monitors API latency and response time degradation
* **Throughput**: Tracks request volume and processing rates
* **Queue Depths**: Monitors message queue backlogs and processing delays
### Infrastructure Metrics
[Section titled “Infrastructure Metrics”](#infrastructure-metrics)
* **Load Balancer Health**: Monitors healthy/unhealthy host counts
* **Database Performance**: Tracks query latency and connection counts
* **Cache Hit Rates**: Monitors cache performance and effectiveness
* **Container Health**: Tracks container restart rates and resource limits
## Anomaly Detection Thresholds
[Section titled “Anomaly Detection Thresholds”](#anomaly-detection-thresholds)
Cased uses intelligent thresholds based on statistical analysis:
### Severity Levels
[Section titled “Severity Levels”](#severity-levels)
* **Medium (1.25x baseline)**: 25% increase from normal - worth investigating
* **High (1.5x baseline)**: 50% increase from normal - significant issue
* **Critical (2.0x baseline)**: 100% increase from normal - urgent attention required
### Metric-Specific Thresholds
[Section titled “Metric-Specific Thresholds”](#metric-specific-thresholds)
* **CPU/Memory**: Resource constraints that could impact performance
* **Error Rates**: More sensitive thresholds since small increases matter
* **Latency**: Response time increases that affect user experience
## Supported Data Sources
[Section titled “Supported Data Sources”](#supported-data-sources)
### AWS CloudWatch
[Section titled “AWS CloudWatch”](#aws-cloudwatch)
* Native integration with AWS services
* Comprehensive metric coverage for EC2, RDS, ELB, Lambda, and more
* Custom metrics and dashboards
* Automated alerting and dashboard creation
### Datadog
[Section titled “Datadog”](#datadog)
* Full-stack monitoring across infrastructure and applications
* Custom metrics and synthetic monitoring
* APM (Application Performance Monitoring) integration
* Log correlation and analysis
## Getting Started
[Section titled “Getting Started”](#getting-started)
To use deployment monitoring:
1. **Connect Data Sources**: Ensure your CloudWatch or Datadog integration is configured
2. **Deploy with Monitoring**: Cased automatically monitors deployments when data sources are connected
3. **Review Anomalies**: Check the Mission Control dashboard for detected anomalies
## Example Monitoring Scenarios
[Section titled “Example Monitoring Scenarios”](#example-monitoring-scenarios)
### Post-Deployment Monitoring
[Section titled “Post-Deployment Monitoring”](#post-deployment-monitoring)
```plaintext
After deploying version 2.1.3:
- CPU usage increased 45% above baseline (HIGH severity)
- Error rate increased 150% (CRITICAL severity)
- Memory usage within normal range
- Database latency increased 30% (MEDIUM severity)
Recommendation: Investigate error rate spike and CPU usage
```
### Resource Anomaly Detection
[Section titled “Resource Anomaly Detection”](#resource-anomaly-detection)
```plaintext
Deployment monitoring detected:
- Memory usage consistently 80% above baseline
- Potential memory leak in new code
- Container restart rate increased 3x
- Database connection pool exhaustion
Action: Rollback recommended, investigate memory management
```
### Performance Degradation
[Section titled “Performance Degradation”](#performance-degradation)
```plaintext
Gradual performance degradation detected:
- API response times increased 60% over 2 hours
- Database query latency doubled
- Cache hit rate decreased 25%
- No error rate increase
Analysis: Database performance issue, possibly query optimization needed
```
## Best Practices
[Section titled “Best Practices”](#best-practices)
### Monitoring Strategy
[Section titled “Monitoring Strategy”](#monitoring-strategy)
1. **Establish Baselines**: Allow sufficient time for baseline establishment before relying on anomaly detection
2. **Gradual Rollouts**: Use canary deployments to limit blast radius of issues
3. **Multiple Metrics**: Don’t rely on single metrics - correlate multiple data points
4. **Regular Reviews**: Periodically review anomaly detection accuracy and adjust thresholds
## Integration with CI/CD
[Section titled “Integration with CI/CD”](#integration-with-cicd)
Cased’s deployment monitoring integrates seamlessly with your existing CI/CD pipeline:
* **Automatic Activation**: Monitoring starts automatically when deployments are detected
* **Status Reporting**: Deployment status updated based on monitoring results
* **Rollback Triggers**: Can trigger automated rollbacks based on anomaly severity
* **Pipeline Integration**: Works with GitHub Actions
# Scan for SOC2 Compliance
> Cased can analyze your infrastructure as code to identify resources that may not be compliant with SOC2 controls, helping you to maintain a strong security and compliance posture.
Cased can analyze your infrastructure as code to identify resources that may not be compliant with SOC2 controls, helping you to maintain a strong security and compliance posture.
Ensuring that your infrastructure is compliant with security standards like SOC2 is a continuous and tedious process. [Cased’s compliance workflows](/agents/overview) will scan your IaC daily or weekly and open pull requests to fix compliance issues for you.
## How it Works
[Section titled “How it Works”](#how-it-works)
Cased’s compliance checking is a multi-step process that combines static analysis with AI and LLM classification and code generation:
1. **Code Analysis**: Cased scans your infrastructure as code and identifies resources and configurations that could have an impact on your compliance posture.
2. **Sub-agent Creation**: For each potential issue, Cased creates a new sub-agent with context about the resource and the potential issue.
3. **Compliance Classification**: Cased then uses an agent to analyze the sub-agent and to determine which, if any, compliance standards it might violate. The agent will add a “compliance\_standards” tag to the sub-agent with the results of its analysis (e.g., “SOC2 CC6.1”).
4. **Review and fix**: You can then review the sub-agents’ work in pull requests, prioritize them based on the compliance standards they affect, and take action to fix any issues.
## Getting Started
[Section titled “Getting Started”](#getting-started)
To get started with compliance checking, you’ll need to enable the infrastructure analysis for your projects. Once enabled, Cased will automatically begin to analyze your Terraform code and to create sub-agents for any potential compliance issues it finds.
# Visualizing AWS Infrastructure
> Cased can create interactive, real-time visualizations of your AWS infrastructure by querying live AWS APIs and generating dynamic graphs showing VPCs, subnets, EC2 instances, RDS databases, ECS services, and more.
Cased can create interactive, real-time visualizations of your AWS infrastructure by querying live AWS APIs and generating dynamic graphs showing VPCs, subnets, EC2 instances, RDS databases, ECS services, and more.
Understanding your AWS infrastructure at a glance is crucial for effective cloud management. Cased provides powerful visualization capabilities that help you see the relationships between your resources, identify potential issues, and make informed decisions about your infrastructure.
## How it Works
[Section titled “How it Works”](#how-it-works)
Cased’s AWS infrastructure visualization is built on live API queries and interactive graph rendering:
1. **Live API Scanning**: Cased queries your AWS APIs in real-time to get current resource states - no stale data from cached inventories.
2. **Intelligent Grouping**: Resources are automatically organized by VPC and subnet relationships for logical grouping.
3. **Interactive Graphs**: The visualization uses React Flow to create interactive, expandable graphs that you can navigate and explore.
4. **Rich Metadata**: Each resource shows detailed information including instance types, states, IP addresses, security groups, and more.
## Supported AWS Resources
[Section titled “Supported AWS Resources”](#supported-aws-resources)
The infrastructure graphing tool supports a comprehensive set of AWS resources:
### Compute Resources
[Section titled “Compute Resources”](#compute-resources)
* **EC2 Instances**: Shows instance types, states, IP addresses, availability zones, and security groups
* **ECS Services**: Displays service status, desired/running counts, cluster information, and task definitions
* **Lambda Functions**: (Coming soon)
### Data Resources
[Section titled “Data Resources”](#data-resources)
* **RDS Instances**: Shows database engine, version, instance class, storage details, and endpoint information
* **ElastiCache Clusters**: Displays cluster status, node types, replication groups, and configuration details
* **DynamoDB Tables**: (Coming soon)
### Networking Resources
[Section titled “Networking Resources”](#networking-resources)
* **VPCs**: Primary organizational containers for your resources
* **Subnets**: Shows availability zones and resource distribution
* **Security Groups**: Displays firewall rules and associations
* **Load Balancers**: (Coming soon)
## Getting Started
[Section titled “Getting Started”](#getting-started)
To visualize your AWS infrastructure, you’ll need:
1. **AWS Connection**: Ensure your AWS data source is connected and working in Cased
2. **Proper Permissions**: Your AWS role needs read permissions for the resources you want to visualize
3. **Agent Access**: Simply ask the Cased agent to “graph my AWS infrastructure” or “show me my infrastructure”
## Example Queries
[Section titled “Example Queries”](#example-queries)
Here are some example requests you can make to the Cased agent:
### Basic Infrastructure Overview
[Section titled “Basic Infrastructure Overview”](#basic-infrastructure-overview)
```plaintext
"Graph my AWS infrastructure"
"Show me my current infrastructure"
"Visualize my AWS resources"
```
### Filtered Views
[Section titled “Filtered Views”](#filtered-views)
```plaintext
"Show me only my RDS and EC2 instances"
"Graph my ECS services and their infrastructure"
"Visualize resources in us-east-1"
```
### Specific Resource Types
[Section titled “Specific Resource Types”](#specific-resource-types)
```plaintext
"Show me all my databases and their network setup"
"Graph my compute resources and their relationships"
"Visualize my container infrastructure"
```
## Interactive Features
[Section titled “Interactive Features”](#interactive-features)
The infrastructure graph provides several interactive capabilities:
### Navigation
[Section titled “Navigation”](#navigation)
* **Pan and Zoom**: Navigate large infrastructures with smooth pan and zoom controls
* **Expandable Nodes**: Click on VPCs and subnets to expand and see contained resources
* **Hover Details**: Hover over any resource to see detailed metadata
### Visual Organization
[Section titled “Visual Organization”](#visual-organization)
* **Hierarchical Layout**: Resources are organized in a clear VPC → Subnet → Resource hierarchy
* **Color Coding**: Different resource types use distinct colors and icons for easy identification
* **Relationship Lines**: Clear visual connections show how resources relate to each other
### Resource Details
[Section titled “Resource Details”](#resource-details)
Each resource node shows relevant metadata:
* **EC2**: Instance ID, type, state, IPs, launch time, security groups
* **RDS**: DB identifier, engine, version, instance class, endpoint, storage details
* **ECS**: Service name, cluster, desired count, running count, task definition
* **ElastiCache**: Cluster ID, node type, replication group, configuration details
## Use Cases
[Section titled “Use Cases”](#use-cases)
### Infrastructure Auditing
[Section titled “Infrastructure Auditing”](#infrastructure-auditing)
Quickly identify:
* Unused or idle resources
* Security group configurations
* Resource distribution across availability zones
* Compliance with organizational standards
### Troubleshooting
[Section titled “Troubleshooting”](#troubleshooting)
Visualize:
* Network connectivity between resources
* Resource dependencies and relationships
* Configuration inconsistencies
* Performance bottlenecks
### Planning and Optimization
[Section titled “Planning and Optimization”](#planning-and-optimization)
Understand:
* Resource utilization patterns
* Cost optimization opportunities
* Scaling requirements
* Architecture improvements
## Best Practices
[Section titled “Best Practices”](#best-practices)
1. **Regular Visualization**: Use infrastructure graphs regularly to maintain awareness of your AWS environment
2. **Filtered Views**: Use resource type filters to focus on specific aspects of your infrastructure
3. **Combine with Monitoring**: Use alongside CloudWatch metrics and other monitoring tools for complete visibility
4. **Document Changes**: Take snapshots of your infrastructure graphs before major changes
5. **Team Collaboration**: Share infrastructure visualizations with team members for better communication
The AWS infrastructure visualization feature provides a powerful way to understand and manage your cloud resources, making complex infrastructure relationships clear and actionable.